Walmart 2015 Annual Report Download - page 23
Download and view the complete annual report
Please find page 23 of the 2015 Walmart annual report below. You can navigate through the pages in the report by either clicking on the pages listed below, or by using the keyword search tool below to find specific information within the annual report.-
 1
1 -
2
-
3
-
4
-
5
-
6
-
7
-
8
-
9
-
10
-
11
-
12
-
 13
13 -
 14
14 -
 15
15 -
 16
16 -
 17
17 -
 18
18 -
 19
19 -
 20
20 -
 21
21 -
 22
22 -
 23
23 -
 24
24 -
 25
25 -
 26
26 -
 27
27 -
 28
28 -
 29
29 -
 30
30 -
 31
31 -
 32
32 -
 33
33 -
34
-
35
-
36
-
37
-
38
-
39
-
40
-
41
-
42
-
43
-
44
-
45
-
46
-
47
-
48
-
49
-
50
-
51
-
52
-
53
-
54
-
55
-
56
-
57
-
58
-
59
-
60
-
61
-
62
-
63
-
64
-
65
-
66
-
67
-
68
 |
 |
21
2015 Annual Report
Management’s Discussion and Analysis of
Financial Condition and Results of Operations
Calendar Comparable Store and Club Sales
Comparable store and club sales is a metric which indicates the performance of our existing U.S. stores and clubs by measuring the change in sales
for such stores and clubs, including e-commerce sales, for a particular period over the corresponding period in the previous year. The retail industry
generally reports comparable store and club sales using the retail calendar (also known as the 4-5-4 calendar). To be consistent with the retail indus-
try, we provide comparable store and club sales using the retail calendar in our quarterly earnings releases. However, when we discuss our compara-
ble store and club sales below, we are referring to our calendar comparable store and club sales calculated using our fiscal calendar. As our fiscal
calendar differs from the retail calendar, our calendar comparable store and club sales also differ from the retail calendar comparable store and club
sales provided in our quarterly earnings releases. Calendar comparable store and club sales, as well as the impact of fuel, for fiscal 2015 and 2014, were
as follows:
Fiscal Years Ended January 31,
2015 2014 2015 2014
With Fuel Fuel Impact
Walmart U.S. 0.6% (0.6)% 0.0% 0.0%
Sam’s Club 0.0% 0.3% (0.6)% (0.3)%
Total U.S. 0.5% (0.5)% (0.1)% (0.1)%
Comparable store and club sales in the U.S., including fuel, increased 0.5% in fiscal 2015 and decreased 0.5% in fiscal 2014, when compared to the
previous fiscal year. The fiscal 2015 total U.S. comparable store and club sales were positively impacted by higher traffic and lower gas prices during
the end of the fiscal year. E-commerce sales positively impacted comparable sales approximately 0.3% and 0.2% for Walmart U.S. and Sam’s Club,
respectively, for the fiscal year ended January 31, 2015. For fiscal 2014, the total U.S. comparable store and club sales were negatively impacted by
lower consumer spending primarily due to the slow recovery in general economic conditions, the 2% increase in the 2013 payroll tax rate, and the
reduction in government food benefits and severe winter storms that occurred during the fourth quarter. These factors were partially offset by
increased member traffic at Sam’s Club primarily coming from Savings Members. Additionally, e-commerce sales positively impacted the Walmart U.S.
comparable store and Sam’s Club comparable club sales percentages by approximately 0.3% for fiscal 2014.
As we continue to add new stores and clubs in the U.S., we do so with an understanding that additional stores and clubs may take sales away from
existing units. We estimate the negative impact on comparable store and club sales as a result of opening new stores and clubs was approximately
0.9% and 0.8% in fiscal 2015 and 2014, respectively. Our estimate is calculated primarily by comparing the sales trends of the impacted stores and
clubs, which are identified based on their proximity to the new stores and clubs, to those of nearby non-impacted stores and clubs, in each case,
as measured after the new stores and clubs are opened.
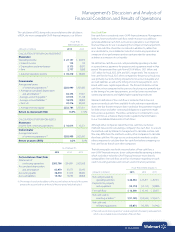
Leverage
Operating Income
Fiscal Years Ended January 31,
(Amounts in millions) 2015 2014 2013
Operating Percent Percent Operating Percent Percent Operating Percent
Income of Total Change Income of Total Change Income of Total
Walmart U.S. $21,336 78.6% (2.1)% $21,787 81.0% 3.2% $21,103 76.1%
Walmart International 6,171 22.7% 19.8% 5,153 19.2% (19.0)% 6,365 23.0%
Sam’s Club 1,976 7.3% 7.2% 1,843 6.9% (0.9)% 1,859 6.7%
Corporate and support (2,336) (8.6)% (22.2)% (1,911) (7.1)% (19.3)% (1,602) (5.8)%
Operating income $27,147 100.0% 1.0% $26,872 100.0% (3.1)% $27,725 100.0%
We believe comparing both the growth of our operating expenses and our operating income to the growth of our net sales are meaningful measures,
as they indicate how effectively we manage costs and leverage operating expenses. Our objective for a fiscal year is to grow operating expenses at a
slower rate than net sales and to grow operating income at the same rate as or a faster rate than net sales. On occasion, we may make strategic growth
investments that may, at times, cause our operating expenses to grow at a faster rate than net sales and that may result in our operating income growing
at a slower rate than net sales.