Walmart 2015 Annual Report Download - page 46
Download and view the complete annual report
Please find page 46 of the 2015 Walmart annual report below. You can navigate through the pages in the report by either clicking on the pages listed below, or by using the keyword search tool below to find specific information within the annual report.-
 1
1 -
2
-
3
-
4
-
5
-
6
-
7
-
8
-
9
-
10
-
11
-
12
-
13
-
14
-
15
-
16
-
17
-
18
-
19
-
20
-
21
-
22
-
23
-
24
-
25
-
26
-
27
-
28
-
29
-
30
-
31
-
32
-
33
-
34
-
35
-
 36
36 -
 37
37 -
 38
38 -
 39
39 -
 40
40 -
 41
41 -
 42
42 -
 43
43 -
 44
44 -
 45
45 -
 46
46 -
 47
47 -
 48
48 -
 49
49 -
 50
50 -
 51
51 -
 52
52 -
 53
53 -
 54
54 -
 55
55 -
 56
56 -
57
-
58
-
59
-
60
-
61
-
62
-
63
-
64
-
65
-
66
-
67
-
68
 |
 |

44 2015 Annual Report
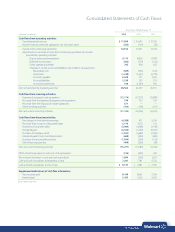
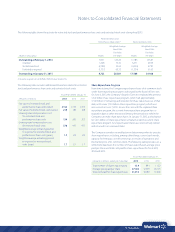
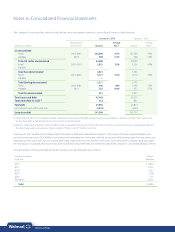
2 Net Income Per Common Share
Basic income per common share from continuing operations
attributable to Walmart is based on the weighted-average common
shares outstanding during the relevant period. Diluted income per
common share from continuing operations attributable to Walmart is
based on the weighted-average common shares outstanding during the
relevant period adjusted for the dilutive effect of share-based awards.
The Company did not have significant share-based awards outstanding
that were antidilutive and not included in the calculation of diluted
income per common share from continuing operations attributable to
Walmart for fiscal 2015, 2014 and 2013.
The following table provides a reconciliation of the numerators and
denominators used to determine basic and diluted income per common
share from continuing operations attributable to Walmart:
Fiscal Years Ended January 31,
(Amounts in millions, except per share data) 2015 2014 2013
Numerator
Income from continuing operations $16,814 $16,551 $17,704
Less income from continuing
operations attributable to
noncontrolling interest (632) (633) (741)
Income from continuing operations
attributable to Walmart $16,182 $15,918 $16,963
Denominator
Weighted-average common shares
outstanding, basic 3,230 3,269 3,374
Dilutive impact of stock options
and other share-based awards 13 14 15
Weighted-average common shares
outstanding, diluted 3,243 3,283 3,389
Income per common share
from continuing operations
attributable to Walmart
Basic $ 5.01 $ 4.87 $ 5.03
Diluted 4.99 4.85 5.01
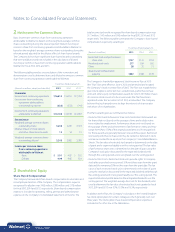
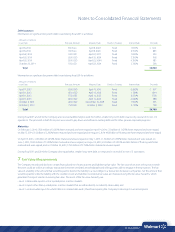
3 Shareholders’ Equity
Share-Based Compensation
The Company has awarded share-based compensation to associates and
nonemployee directors of the Company. The compensation expense
recognized for all plans was $462 million, $388 million and $378 million
for fiscal 2015, 2014 and 2013, respectively. Share-based compensation
expense is included in operating, selling, general and administrative
expenses in the Company’s Consolidated Statements of Income. The
total income tax benefit recognized for share-based compensation was
$173 million, $145 million and $142 million for fiscal 2015, 2014 and 2013,
respectively. The following table summarizes the Company’s share-based
compensation expense by award type:
Fiscal Years Ended January 31,
(Amounts in millions) 2015 2014 2013
Restricted stock and performance
share units $157 $141 $152
Restricted stock units 277 224 195
Other 28 23 31
Share-based compensation
expense $462 $388 $378
The Company’s shareholder-approved Stock Incentive Plan of 2010
(the “Plan”) became effective June 4, 2010 and amended and restated
the Company’s Stock Incentive Plan of 2005. The Plan was established to
grant stock options, restricted (non-vested) stock, performance share
units and other equity compensation awards for which 210 million shares
of common stock issued or to be issued under the Plan have been
registered under the Securities Act of 1933, as amended. The Company
believes that such awards serve to align the interests of its associates
with those of its shareholders.
The Plan’s award types are summarized as follows:
• Restricted Stock and Performance Share Units. Restricted stock awards are
for shares that vest based on the passage of time and include restric-
tions related to employment. Performance share units vest based on
the passage of time and achievement of performance criteria and may
range from 0% to 150% of the original award amount. Vesting periods
for these awards are generally between one and three years. Restricted
stock and performance share units may be settled or deferred in stock
and are accounted for as equity in the Company’s Consolidated Balance
Sheets. The fair value of restricted stock awards is determined on the date
of grant and is expensed ratably over the vesting period. The fair value
of performance share units is determined on the date of grant using the
Company’s stock price discounted for the expected dividend yield
through the vesting period and is recognized over the vesting period.
• Restricted Stock Units. Restricted stock units provide rights to Company
stock after a specified service period; 50% vest three years from the grant
date and the remaining 50% vest five years from the grant date. The fair
value of each restricted stock unit is determined on the date of grant
using the stock price discounted for the expected dividend yield through
the vesting period and is recognized ratably over the vesting period. The
expected dividend yield is based on the anticipated dividends over the
vesting period. The weighted-average discount for the dividend yield
used to determine the fair value of restricted stock units granted in fiscal
2015, 2014 and 2013 was 9.5%, 10.3% and 12.2%, respectively.
In addition to the Plan, the Company’s subsidiary in the United Kingdom
has stock option plans for certain colleagues which generally vest over
three years. The stock option share-based compensation expense is
included in the other line in the table above.
Notes to Consolidated Financial Statements