Walmart 2015 Annual Report Download - page 28
Download and view the complete annual report
Please find page 28 of the 2015 Walmart annual report below. You can navigate through the pages in the report by either clicking on the pages listed below, or by using the keyword search tool below to find specific information within the annual report.-
 1
1 -
2
-
3
-
4
-
5
-
6
-
7
-
8
-
9
-
10
-
11
-
12
-
13
-
14
-
15
-
16
-
17
-
 18
18 -
 19
19 -
 20
20 -
 21
21 -
 22
22 -
 23
23 -
 24
24 -
 25
25 -
 26
26 -
 27
27 -
 28
28 -
 29
29 -
 30
30 -
 31
31 -
 32
32 -
 33
33 -
 34
34 -
 35
35 -
 36
36 -
 37
37 -
 38
38 -
39
-
40
-
41
-
42
-
43
-
44
-
45
-
46
-
47
-
48
-
49
-
50
-
51
-
52
-
53
-
54
-
55
-
56
-
57
-
58
-
59
-
60
-
61
-
62
-
63
-
64
-
65
-
66
-
67
-
68
 |
 |
26 2015 Annual Report
Management’s Discussion and Analysis of
Financial Condition and Results of Operations
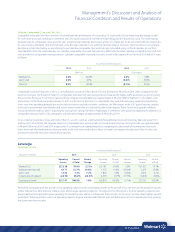
As a result of the factors discussed above, segment operating income
was $6.2 billion, $5.2 billion and $6.4 billion for fiscal 2015, 2014 and 2013,
respectively. Fluctuations in currency exchange rates negatively impacted
operating income $225 million, $26 million and $111 million in fiscal 2015,
2014 and 2013 respectively. Although currency fluctuations caused net
sales for Walmart International to decline, operating income grew for fiscal
2015. Operating income did not grow faster than net sales in fiscal 2014.
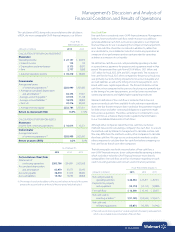
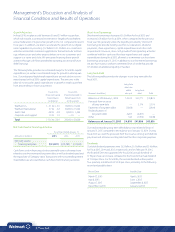
Sam’s Club Segment
We believe the information in the following table under the caption
“Excluding Fuel” is useful to investors because it permits investors to
understand the effect of the Sam’s Club segment’s fuel sales on its
results of operations, which are impacted by the volatility of fuel prices.
Volatility in fuel prices may continue to impact the operating results
of the Sam’s Club segment in the future.
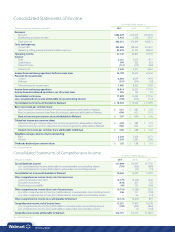
(Amounts in millions, Fiscal Years Ended January 31,
except unit counts) 2015 2014 2013
Including Fuel
Net sales $58,020 $57,157 $56,423
Percentage change from
comparable period 1.5% 1.3% 4.9%
Calendar comparable
club sales increase 0.0% 0.3% 4.1%
Operating income $ 1,976 $ 1,843 $ 1,859
Operating income as
a percentage of net sales 3.4% 3.2% 3.3%
Unit counts at period end 647 632 620
Retail square feet at period end 87 84 83
Excluding Fuel
Net sales $51,630 $50,574 $49,789
Percentage change from
comparable period 2.1% 1.6% 4.6%
Operating income $ 1,854 $ 1,817 $ 1,812
Operating income as
a percentage of net sales 3.6% 3.6% 3.6%
Net sales for the Sam’s Club segment increased 1.5% and 1.3% for fiscal
2015 and 2014, respectively, when compared to the previous fiscal year.
The fiscal 2015 increase in net sales was primarily due to year-over-year
growth in retail square feet of 2.5%, driven by the addition of 15 new
clubs, partially offset by a decrease in fuel sales due to the lower average
selling price. Comparable club sales were flat for fiscal 2015. The fiscal
2014 increase in net sales was due to year-over-year growth in retail
square feet of 2.1%, driven by the addition of 12 new clubs, as well as pos-
itive comparable club sales of 0.3%. The fiscal 2014 positive comparable
club sales were the result of increased member traffic primarily coming
from our Savings Members, partially offset by severe winter storms that
occurred in the fourth quarter of fiscal 2014.
Gross profit rate decreased 12 basis points for fiscal 2015 and was flat for
fiscal 2014, when compared to the previous fiscal year. For fiscal 2015, the
gross profit rate decreased primarily due to the segment’s investment in
the Cash Rewards program, changes in merchandise mix, and commodity
cost inflation, partially offset by an increased gross profit rate on fuel sales.
For fiscal 2014, our gross profit was negatively impacted by an increase
to our product warranty liabilities, which was offset by a favorable impact
from merchandise mix.
Membership and other income increased 7.7% and 14.1% for fiscal 2015
and 2014, respectively, when compared to the previous fiscal year. For
fiscal 2015, the increase was primarily the result of increased membership
upgrades, Plus Member renewals and an increase in members from the
opening of 15 new clubs. For fiscal 2014, the increase was primarily due
to improved contract terms relating to the profit sharing arrangement
with our credit card provider, increased membership fees that were
introduced on May 15, 2013, $24 million of income from the sale of two
real estate properties and an increase in members from the opening
of 12 new clubs.
Sam’s Club leveraged operating expenses for fiscal 2015, as operating
expenses as a percentage of segment net sales decreased 16 basis points
compared to the previous fiscal year. The decrease in operating expenses
as a percentage of segment net sales for fiscal 2015 was primarily due to
better expense management in a number of areas, including the opti-
mization of the new in-club staffing structure announced in fiscal 2014,
which resulted in decreases in wage expense and payroll taxes. This was
partially offset by higher health-care expenses, mostly from increased
enrollment and medical cost inflation. For fiscal 2014, Sam’s Club did not
leverage expenses, as operating expenses as a percentage of segment
net sales increased 26 basis points, when compared to the previous fiscal
year. The increase in operating expenses as a percentage of segment net
sales was primarily due to a $59 million charge for the implementation
of the new in-club staffing structure and the pending closure of one club,
as well as a state excise tax refund credit we received in the previous
fiscal year.
As a result of the factors discussed above, operating income was
$2.0 billion, $1.8 billion and $1.9 billion for fiscal 2015, 2014 and 2013,
respectively. Sam’s Club did grow operating income faster than
net sales in fiscal 2015, but did not grow operating income faster than
sales in fiscal 2014.
Liquidity and Capital Resources
Liquidity
The strength and stability of our operations have historically supplied us
with a significant source of liquidity. Our cash flows provided by operating
activities, supplemented with our long-term debt and short-term bor-
rowings, have been sufficient to fund our operations while allowing us to
invest in activities that support the long-term growth of our operations.
Generally, some or all of the remaining available cash flow has been used
to fund the dividends on our common stock and share repurchases.
We believe our sources of liquidity will continue to be adequate to fund
operations, finance our global expansion activities, pay dividends and
fund our share repurchases for the foreseeable future.
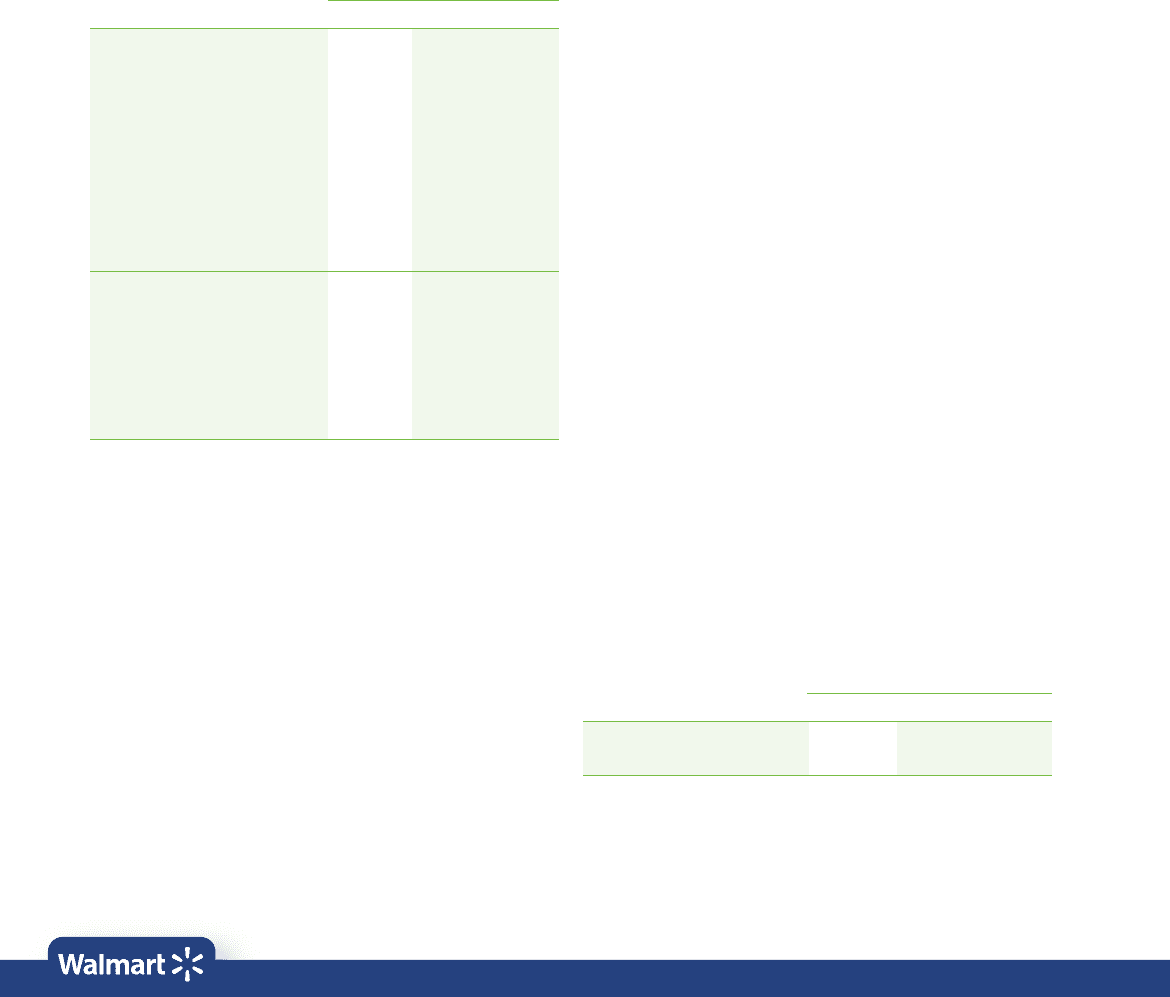
Net Cash Provided by Operating Activities
Fiscal Years Ended January 31,
(Amounts in millions) 2015 2014 2013
Net cash provided by
operating activities $28,564 $23,257 $25,591