Walmart 2015 Annual Report Download - page 27
Download and view the complete annual report
Please find page 27 of the 2015 Walmart annual report below. You can navigate through the pages in the report by either clicking on the pages listed below, or by using the keyword search tool below to find specific information within the annual report.-
 1
1 -
2
-
3
-
4
-
5
-
6
-
7
-
8
-
9
-
10
-
11
-
12
-
13
-
14
-
15
-
16
-
 17
17 -
 18
18 -
 19
19 -
 20
20 -
 21
21 -
 22
22 -
 23
23 -
 24
24 -
 25
25 -
 26
26 -
 27
27 -
 28
28 -
 29
29 -
 30
30 -
 31
31 -
 32
32 -
 33
33 -
 34
34 -
 35
35 -
 36
36 -
 37
37 -
38
-
39
-
40
-
41
-
42
-
43
-
44
-
45
-
46
-
47
-
48
-
49
-
50
-
51
-
52
-
53
-
54
-
55
-
56
-
57
-
58
-
59
-
60
-
61
-
62
-
63
-
64
-
65
-
66
-
67
-
68
 |
 |

25
2015 Annual Report
Management’s Discussion and Analysis of
Financial Condition and Results of Operations
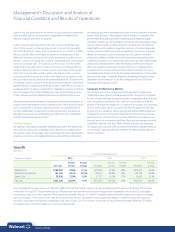
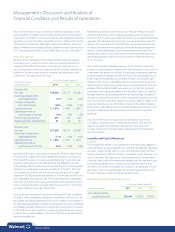
Walmart U.S. Segment
(Amounts in millions, Fiscal Years Ended January 31,
except unit counts) 2015 2014 2013
Net sales $288,049 $279,406 $274,433
Percentage change from
comparable period 3.1% 1.8% 3.9%
Calendar comparable
store sales increase
(decrease) 0.6% (0.6)% 2.0%
Operating income $ 21,336 $ 21,787 $ 21,103
Operating income as a
percentage of net sales 7.4% 7.8% 7.7%
Unit counts at period end 4,516 4,203 4,005
Retail square feet at
period end 680 659 641
Net sales for the Walmart U.S. segment increased 3.1% and 1.8% for fiscal
2015 and 2014, respectively, when compared to the previous fiscal year.
For fiscal 2015, the increase in net sales was due to year-over-year growth
in retail square feet of 3.2%, as well as an increase in comparable store
sales of 0.6%. Positive traffic and lower gas prices late in the fiscal year
contributed to the increase in comparable store sales. For fiscal 2014, the
increase in net sales was due to year-over-year growth in retail square
feet of 2.9%, partially offset by a decline in comparable store sales of 0.6%.
Fiscal 2014 comparable store sales were negatively impacted by lower
consumer spending primarily due to the slow recovery in general eco-
nomic conditions, the 2% increase in the 2013 payroll tax rate and the
reduction in government food benefits.
The fiscal 2015 gross profit rate decreased 12 basis points compared to
the previous fiscal year. The decrease in the gross profit rate was primarily
the result of the segment’s strategic focus on price investment, pharmacy
cost inflation, reductions in third-party reimbursement rates and changes
in merchandise mix. The fiscal year 2014 gross profit rate was relatively
flat when compared to the previous fiscal year primarily due to price
investment and low price leadership, partially offset by cost of goods
savings initiatives and supply chain productivity.
Walmart U.S. did not leverage operating expenses for fiscal 2015, as
operating expenses as a percentage of segment net sales increased
24 basis points. The increase in operating expenses as a percentage of
segment net sales was primarily driven by higher health-care expenses
from increased enrollment and medical cost inflation. In addition,
expenses from severe winter storms early in the year contributed to the
increase in operating expenses as a percentage of segment net sales.
Walmart U.S. leveraged operating expenses for fiscal 2014, driven by
productivity initiatives as well as lower incentive expenses in fiscal 2014.
As a result of the factors discussed above, segment operating income
was $21.3 billion, $21.8 billion and $21.1 billion during fiscal 2015, 2014 and
2013, respectively. Walmart U.S. did not grow operating income faster
than sales during fiscal 2015, but grew operating income faster than sales
during fiscal 2014.
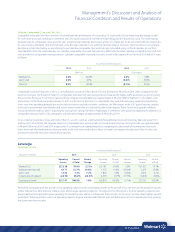
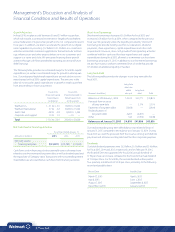
Walmart International Segment
(Amounts in millions, Fiscal Years Ended January 31,
except unit counts) 2015 2014 2013
Net sales $136,160 $136,513 $134,748
Percentage change from
comparable period (0.3)% 1.3% 7.4%
Operating income $ 6,171 $ 5,153 $ 6,365
Operating income as a
percentage of net sales 4.5% 3.8% 4.7%
Unit counts at period end 6,290 6,107 5,783
Retail square feet at
period end 368 358 346
Net sales for the Walmart International segment decreased 0.3% and
increased 1.3% for fiscal 2015 and 2014, respectively, when compared to
the previous fiscal year. For fiscal 2015, the decrease in net sales was due
to $5.3 billion of negative impact from fluctuations in currency exchange
rates, partially offset by year-over-year net growth in retail square feet of
2.6% and higher e-commerce sales in each country with e-commerce
operations, particularly in the United Kingdom, China and Brazil. For
fiscal 2014, the increase in net sales was due to year-over-year net growth
in retail square feet of 3.6% and the impact of fiscal 2013 acquisitions,
which accounted for $730 million of the net sales increase. In addition,
higher e-commerce sales in each country with e-commerce operations
contributed to the increase. The increase in net sales was partially offset
by $5.1 billion of negative impact from fluctuations in currency
exchange rates.
Gross profit rate increased 12 basis points for fiscal 2015 and decreased
10 basis points for fiscal 2014, when compared to the previous fiscal year.
The fiscal 2015 increase in gross profit rate was primarily due to changes
in the merchandise mix in a number of the segment’s larger operations.
The fiscal 2014 decrease in gross profit rate was primarily due to price
investments in certain countries, including Brazil, Canada and Mexico.
Operating expenses as a percentage of net sales decreased 51 basis
points for fiscal 2015, when compared to the previous fiscal year. The
decrease was due to the nearly $1.0 billion of aggregated expenses
incurred in fiscal 2014 detailed below, which were partially offset by fiscal
2015 expenses of $148 million related to the closure of approximately
30 underperforming stores in Japan.
For fiscal 2014, operating expenses as a percentage of net sales increased
80 basis points, when compared to the previous fiscal year. Operating
expenses as a percentage of net sales were primarily impacted by the
nearly $1.0 billion of aggregated expenses for the following matters:
• Charges for contingencies for non-income taxes and employment
claims in Brazil;
• Charges for the closure of 29 units in China and 25 units in Brazil due
to poor performance;
• Store lease expenses in China and Mexico to correct a historical
accounting practice that did not conform to our global accounting
policies; and
• Expenses for the termination of the joint venture, franchise and supply
agreements related to our former partner’s retail store operations
in India.