Walmart 2015 Annual Report Download - page 26
Download and view the complete annual report
Please find page 26 of the 2015 Walmart annual report below. You can navigate through the pages in the report by either clicking on the pages listed below, or by using the keyword search tool below to find specific information within the annual report.-
 1
1 -
2
-
3
-
4
-
5
-
6
-
7
-
8
-
9
-
10
-
11
-
12
-
13
-
14
-
15
-
 16
16 -
 17
17 -
 18
18 -
 19
19 -
 20
20 -
 21
21 -
 22
22 -
 23
23 -
 24
24 -
 25
25 -
 26
26 -
 27
27 -
 28
28 -
 29
29 -
 30
30 -
 31
31 -
 32
32 -
 33
33 -
 34
34 -
 35
35 -
 36
36 -
37
-
38
-
39
-
40
-
41
-
42
-
43
-
44
-
45
-
46
-
47
-
48
-
49
-
50
-
51
-
52
-
53
-
54
-
55
-
56
-
57
-
58
-
59
-
60
-
61
-
62
-
63
-
64
-
65
-
66
-
67
-
68
 |
 |

24 2015 Annual Report
Management’s Discussion and Analysis of
Financial Condition and Results of Operations
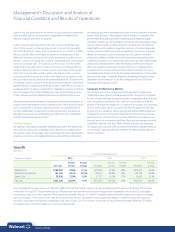
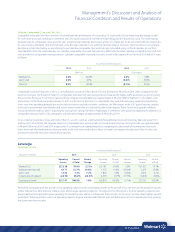
Results of Operations
Consolidated Results of Operations
(Amounts in millions, Fiscal Years Ended January 31,
except unit counts) 2015 2014 2013
Total revenues $485,651 $476,294 $468,651
Percentage change from
comparable period 2.0% 1.6% 5.0%
Net sales $482,229 $473,076 $465,604
Percentage change from
comparable period 1.9% 1.6% 5.0%
Total U.S. calendar comparable
store and club sales increase
(decrease) 0.5% (0.5)% 2.4%
Gross profit margin as a
percentage of net sales 24.3% 24.3% 24.3%
Operating income $ 27,147 $ 26,872 $ 27,725
Operating income as a
percentage of net sales 5.6% 5.7% 6.0%
Income from continuing
operations $ 16,814 $ 16,551 $ 17,704
Unit counts at period end 11,453 10,942 10,408
Retail square feet at period end 1,135 1,101 1,070
Our total revenues, which are mostly comprised of net sales, but also
include membership and other income, increased 2.0% and 1.6% for fiscal
2015 and 2014, respectively, when compared to the previous fiscal year.
The increase in total revenues was consistent with the 1.9% and 1.6%
increases in net sales. The increase in net sales was primarily due to 3.0%
year-over-year growth in retail square feet, positive comparable sales in
the U.S. and higher e-commerce sales across the Company. The increase
was partially offset by $5.3 billion of negative impact from fluctuations in
currency exchange rates for fiscal 2015. The increase in net sales for fiscal
2014 was due to 3.1% growth in retail square feet, higher e-commerce
sales, the impact of fiscal 2013 acquisitions and positive comparable club
sales at Sam’s Club. The increase in net sales for fiscal 2014 was partially
offset by $5.1 billion of negative impact from fluctuations in currency
exchange rates. An increase in membership and other income in both
fiscal years, primarily due to growth in membership income at Sam’s
Club, also contributed to the increase in total revenues.
Our gross profit rate was relatively flat for fiscal 2015, when compared to the
previous fiscal year. While the gross profit rate at Walmart International
increased, the gross profit rate at Walmart U.S. and Sam’s Club decreased.
Our gross profit rate decreased 3 basis points for fiscal 2014, when
compared to the previous fiscal year, primarily due to our ongoing
investment in price, as well as merchandise mix.
For fiscal 2015, we did not meet our objective of growing operating
expenses at a slower rate than net sales as operating expenses as a
percentage of net sales increased 6 basis points when compared to the
same period in the previous fiscal year. Our continued investments in
digital retail, higher health-care expenses in the U.S. from increased
enrollment and medical cost inflation, the $249 million impact of wage
and hour litigation in the U.S., as well as expenses of $148 million related
to the closure of approximately 30 underperforming stores in Japan were
the primary factors that caused us not to leverage for fiscal 2015. For fiscal
2014, we did not meet our objective of growing operating expenses at a
slower rate than net sales as operating expenses as a percentage of net
sales increased 27 basis points. Overall, lower than anticipated net sales,
higher investment in key areas, such as global leverage and e-commerce
initiatives, and nearly $1.0 billion of increased expenses for various matters
described in the Walmart International
segment discussion, were the
primary cause for the increase in operating expenses as a percentage of
net sales.
For fiscal 2015, we did not meet our objective of growing operating
income at the same rate or a faster rate than net sales as operating
income increased 1.0% while net sales increased 1.9% when compared
to the previous fiscal year. This was primarily due to the factors we
discussed for not leveraging operating expenses. For fiscal 2014, we also
did not meet our objective of growing operating income at a faster
rate than net sales as operating income decreased 3.1% while net sales
increased 1.6%, when compared to the previous fiscal year. This was
primarily due to the factors we discussed for not leveraging operating
expenses, partially offset by increases in membership and other income.
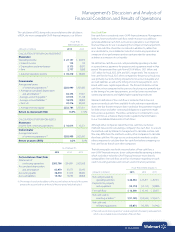
Our effective income tax rates were 32.2%, 32.9% and 31.0%, for fiscal 2015,
2014 and 2013, respectively. The reconciliation from the U.S. statutory
rate to the effective income tax rates for fiscal 2015, 2014 and 2013 is pre-
sented in Note 9 in the “Notes to Consolidated Financial Statements.”
As a result of the factors discussed above, we reported $16.8 billion,
$16.6 billion and $17.7 billion of consolidated income from continuing
operations for fiscal 2015, 2014 and 2013, respectively, an increase of
$263.0 million for fiscal 2015 and a decrease of $1.1 billion for fiscal 2014
when compared to the previous fiscal year. Diluted income from
continuing operations per common share attributable to Walmart (“EPS”)
was $4.99, $4.85 and $5.01 for fiscal 2015, 2014 and 2013, respectively.