Walmart 2015 Annual Report Download - page 43
Download and view the complete annual report
Please find page 43 of the 2015 Walmart annual report below. You can navigate through the pages in the report by either clicking on the pages listed below, or by using the keyword search tool below to find specific information within the annual report.-
 1
1 -
2
-
3
-
4
-
5
-
6
-
7
-
8
-
9
-
10
-
11
-
12
-
13
-
14
-
15
-
16
-
17
-
18
-
19
-
20
-
21
-
22
-
23
-
24
-
25
-
26
-
27
-
28
-
29
-
30
-
31
-
32
-
 33
33 -
 34
34 -
 35
35 -
 36
36 -
 37
37 -
 38
38 -
 39
39 -
 40
40 -
 41
41 -
 42
42 -
 43
43 -
 44
44 -
 45
45 -
 46
46 -
 47
47 -
 48
48 -
 49
49 -
 50
50 -
 51
51 -
 52
52 -
 53
53 -
54
-
55
-
56
-
57
-
58
-
59
-
60
-
61
-
62
-
63
-
64
-
65
-
66
-
67
-
68
 |
 |

41
2015 Annual Report
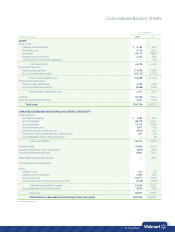
Inventories
The Company values inventories at the lower of cost or market as
determined primarily by the retail inventory method of accounting,
using the last-in, first-out (“LIFO”) method for substantially all of the
Walmart U.S. segment’s inventories. The inventory at the Walmart
International segment is valued primarily by the retail inventory method
of accounting, using the first-in, first-out (“FIFO”) method. The retail
inventory method of accounting results in inventory being valued at the
lower of cost or market since permanent markdowns are immediately
recorded as a reduction of the retail value of inventory. The inventory at
the Sam’s Club segment is valued based on the weighted-average cost
using the LIFO method. At January 31, 2015 and January 31, 2014, the
Company’s inventories valued at LIFO approximated those inventories
as if they were valued at FIFO.
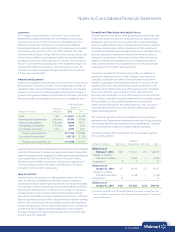
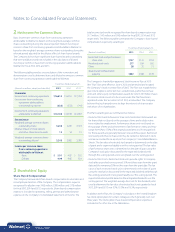
Property and Equipment
Property and equipment are stated at cost. Gains or losses on disposition
are recognized as earned or incurred. Costs of major improvements are
capitalized, while costs of normal repairs and maintenance are charged
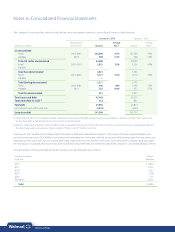
to expense as incurred. The following table summarizes the Company’s
property and equipment balances and includes the estimated useful lives
that are generally used to depreciate the assets on a straight-line basis:
Fiscal Years Ended
Estimated January 31,
(Amounts in millions) Useful Lives 2015 2014
Land N/A $ 26,261 $ 26,184
Buildings and improvements 3-40 years 97,496 95,488
Fixtures and equipment 2-30 years 45,044 42,971
Transportation equipment 3-15 years 2,807 2,785
Construction in progress N/A 5,787 5,661
Property and equipment $177,395 $173,089
Accumulated depreciation (63,115) (57,725)
Property and equipment, net $114,280 $115,364
Leasehold improvements are depreciated over the shorter of the estimated
useful life of the asset or the remaining expected lease term. Depreciation
expense for property and equipment, including amortization of property
under capital leases, for fiscal 2015, 2014 and 2013 was $9.1 billion,
$8.8 billion and $8.4 billion, respectively. Interest costs capitalized on
construction projects were $59 million, $78 million and $74 million
in fiscal 2015, 2014 and 2013, respectively.
Long-Lived Assets
Long-lived assets are stated at cost. Management reviews long-lived
assets for indicators of impairment whenever events or changes in
circumstances indicate that the carrying amount may not be recoverable.
The evaluation is performed at the lowest level of identifiable cash flows,
which is at the individual store or club level or, in certain circumstances,
a market group of stores. Undiscounted cash flows expected to be
generated by the related assets are estimated over the assets’ useful lives
based on updated projections. If the evaluation indicates that the carrying
amount of the assets may not be recoverable, any potential impairment
is measured based upon the fair value of the related asset or asset group
as determined by an appropriate market appraisal or other valuation
technique. Impairment charges of long-lived assets for fiscal 2015, 2014
and 2013 were not significant.
Goodwill and Other Acquired Intangible Assets
Goodwill represents the excess of the purchase price over the fair value
of net assets acquired in business combinations and is allocated to the
appropriate reporting unit when acquired. Other acquired intangible
assets are stated at the fair value acquired as determined by a valuation
technique commensurate with the intended use of the related asset.
Goodwill and indefinite-lived intangible assets are not amortized; rather,
they are evaluated for impairment annually and whenever events or
changes in circumstances indicate that the value of the asset may be
impaired. Definite-lived intangible assets are considered long-lived
assets and are amortized on a straight-line basis over the periods that
expected economic benefits will be provided.
Goodwill is evaluated for impairment using either a qualitative or
quantitative approach for each of the Company’s reporting units.
Generally, a qualitative assessment is first performed to determine
whether a quantitative goodwill impairment test is necessary. If man-
agement determines, after performing an assessment based on the
qualitative factors, that the fair value of the reporting unit is more likely
than not less than the carrying amount, or that a fair value of the
reporting unit substantially in excess of the carrying amount cannot be
assured, then a quantitative goodwill impairment test would be required.
The quantitative test for goodwill impairment is performed by
determining the fair value of the related reporting units. Fair value is
measured based on the discounted cash flow method and relative
market-based approaches.
The Company’s reporting units were evaluated using a quantitative
impairment test. Management determined the fair value of each reporting
unit is greater than the carrying amount and, accordingly, the Company
has not recorded any impairment charges related to goodwill.
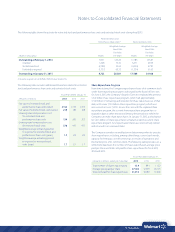
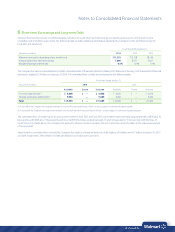
The following table reflects goodwill activity, by reportable segment,
for fiscal 2015 and 2014:
Walmart
(Amounts in millions) Walmart U.S. International Sam’s Club Total
Balances as of
February 1, 2013 $443 $19,741 $313 $20,497
Changes in currency
translation and other — (1,000) — (1,000)
Acquisitions
(1)
8 5 — 13
Balances as of
January 31, 2014 451 18,746 313 19,510
Changes in currency
translation and other — (1,418) — (1,418)
Acquisitions
(1)
10 — — 10
Balances as of
January 31, 2015 $461 $17,328 $313 $18,102
(1) Goodwill recorded for fiscal 2015 and 2014 acquisitions relates to acquisitions that
are not significant, individually or in the aggregate, to the Company’s Consolidated
Financial Statements.
Notes to Consolidated Financial Statements