Walmart 2015 Annual Report Download - page 22
Download and view the complete annual report
Please find page 22 of the 2015 Walmart annual report below. You can navigate through the pages in the report by either clicking on the pages listed below, or by using the keyword search tool below to find specific information within the annual report.-
 1
1 -
2
-
3
-
4
-
5
-
6
-
7
-
8
-
9
-
10
-
11
-
 12
12 -
 13
13 -
 14
14 -
 15
15 -
 16
16 -
 17
17 -
 18
18 -
 19
19 -
 20
20 -
 21
21 -
 22
22 -
 23
23 -
 24
24 -
 25
25 -
 26
26 -
 27
27 -
 28
28 -
 29
29 -
 30
30 -
 31
31 -
 32
32 -
33
-
34
-
35
-
36
-
37
-
38
-
39
-
40
-
41
-
42
-
43
-
44
-
45
-
46
-
47
-
48
-
49
-
50
-
51
-
52
-
53
-
54
-
55
-
56
-
57
-
58
-
59
-
60
-
61
-
62
-
63
-
64
-
65
-
66
-
67
-
68
 |
 |

20 2015 Annual Report
Management’s Discussion and Analysis of
Financial Condition and Results of Operations
varies across the retail industry. As a result, our calculation of comparable
store and club sales is not necessarily comparable to similarly titled
measures reported by other companies.
In discussing our operating results, the term currency exchange rates
refers to the currency exchange rates we use to convert the operating
results for all countries where the functional currency is not the U.S. dollar.
We calculate the effect of changes in currency exchange rates as the
difference between current period activity translated using the current
period’s currency exchange rates, and the comparable prior year period’s
currency exchange rates. Throughout our discussion, we refer to the
results of this calculation as the impact of currency exchange rate fluc-
tuations. When we refer to constant currency operating results, we are
referring to our operating results without the impact of the currency
exchange rate fluctuations and without the impact of acquisitions until
the acquisitions are included in both comparable periods. The disclosure
of constant currency amounts or results permits investors to understand
better Walmart’s underlying performance without the effects of currency
exchange rate fluctuations or acquisitions. Volatility in currency exchange
rates may impact the results, including net sales and operating income,
of the Company and the Walmart International segment in the future.
We made certain reclassifications to prior period amounts or balances to
conform to the presentation in the current fiscal year. These reclassifications
did not impact the Company’s operating income or consolidated net
income. Additionally, certain prior period segment asset and expense
allocations have been reclassified among segments to be comparable
with the current period presentation.
The Retail Industry
We operate in the highly competitive retail industry in all of the markets we
serve. We face strong sales competition from other discount, department,
drug, dollar, variety and specialty stores, warehouse clubs and supermarkets,
as well as e-commerce and catalog businesses. Many of these competitors
are national, regional or international chains or have a national or interna-
tional online presence. We compete with a number of companies for
prime retail site locations, as well as in attracting and retaining quality
employees (whom we call “associates”). We, along with other retail compa-
nies, are influenced by a number of factors including, but not limited to:
catastrophic events, weather, competitive pressures, consumer disposable
income, consumer debt levels and buying patterns, consumer credit avail-
ability, cost of goods, currency exchange rate fluctuations, customer
preferences, deflation, inflation, fuel and energy prices, general economic
conditions, insurance costs, interest rates, labor costs, tax rates, cybersecurity
attacks and unemployment. Further information on the factors that can
affect our operating results and on certain risks to our Company and an
investment in its securities can be located in “Item 1A. Risk Factors” in our
Annual Report on Form 10-K for the fiscal year ended January 31, 2015, and in
the discussion under “Cautionary Statement Regarding Forward-Looking
Statements and Information” in our Annual Report on Form 10-K for the
fiscal year ended January 31, 2015.
Company Performance Metrics
Our performance metrics emphasize three priorities for improving
shareholder value: growth, leverage and returns. Our priority of growth
focuses on sales through growth in net sales, comparable store and club
sales, including e-commerce sales, and unit square feet growth; the
priority of leverage encompasses our objective to increase our operating
income at the same rate as or a faster rate than the growth in net sales
by growing our operating, selling, general and administrative expenses
(“operating expenses”) at a slower rate than the growth of our net sales;
and the priority of returns focuses on how efficiently we employ assets
through return on investment and how effectively we manage working
capital through free cash flow. While all three priorities are important,
our top priority is growth, with increased investment in digital retail and
our associates. Sales growth will contribute to improving leverage and
returns over time.
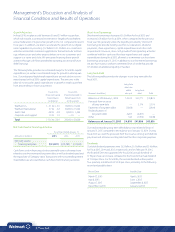
Growth
Net Sales
Fiscal Years Ended January 31,
(Amounts in millions) 2015 2014 2013
Percent Percent Percent Percent Percent
Net Sales of Total Change Net Sales of Total Change Net Sales of Total
Walmart U.S. $288,049 59.8% 3.1% $279,406 59.0% 1.8% $274,433 59.0%
Walmart International 136,160 28.2% (0.3)% 136,513 28.9% 1.3% 134,748 28.9%
Sam’s Club 58,020 12.0% 1.5% 57,157 12.1% 1.3% 56,423 12.1%
Net sales $482,229 100.0% 1.9% $473,076 100.0% 1.6% $465,604 100.0%
Our consolidated net sales increased 1.9% and 1.6% for fiscal 2015 and 2014, respectively, when compared to the previous fiscal year. The increase
in net sales for fiscal 2015 was primarily due to 3.0% year-over-year growth in retail square feet, positive comparable sales in the U.S. and higher
e-commerce sales across the Company. The increase was partially offset by $5.3 billion of negative impact from fluctuations in currency exchange
rates for fiscal 2015. The increase in net sales for fiscal 2014 was due to 3.1% growth in retail square feet, higher e-commerce sales, the impact of
fiscal 2013 acquisitions and positive comparable club sales at Sam’s Club. The increase in net sales for fiscal 2014 was partially offset by $5.1 billion
of negative impact from fluctuations in currency exchange rates.