Walmart 2015 Annual Report Download - page 41
Download and view the complete annual report
Please find page 41 of the 2015 Walmart annual report below. You can navigate through the pages in the report by either clicking on the pages listed below, or by using the keyword search tool below to find specific information within the annual report.-
 1
1 -
2
-
3
-
4
-
5
-
6
-
7
-
8
-
9
-
10
-
11
-
12
-
13
-
14
-
15
-
16
-
17
-
18
-
19
-
20
-
21
-
22
-
23
-
24
-
25
-
26
-
27
-
28
-
29
-
30
-
 31
31 -
 32
32 -
 33
33 -
 34
34 -
 35
35 -
 36
36 -
 37
37 -
 38
38 -
 39
39 -
 40
40 -
 41
41 -
 42
42 -
 43
43 -
 44
44 -
 45
45 -
 46
46 -
 47
47 -
 48
48 -
 49
49 -
 50
50 -
 51
51 -
52
-
53
-
54
-
55
-
56
-
57
-
58
-
59
-
60
-
61
-
62
-
63
-
64
-
65
-
66
-
67
-
68
 |
 |

39
2015 Annual Report
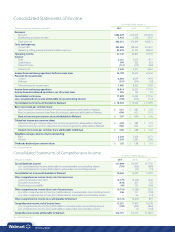
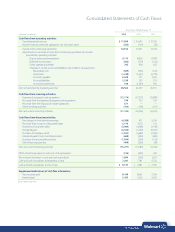
Fiscal Years Ended January 31,
(Amounts in millions) 2015 2014 2013
Cash ows from operating activities:
Consolidated net income $ 17,099 $ 16,695 $ 17,756
Income from discontinued operations, net of income taxes (285) (144) (52)
Income from continuing operations 16,814 16,551 17,704
Adjustments to reconcile income from continuing operations to net cash
provided by operating activities:
Depreciation and amortization 9,173 8,870 8,478
Deferred income taxes (503) (279) (133)
Other operating activities 785 938 602
Changes in certain assets and liabilities, net of effects of acquisitions:
Receivables, net (569) (566) (614)
Inventories (1,229) (1,667) (2,759)
Accounts payable 2,678 531 1,061
Accrued liabilities 1,249 103 271
Accrued income taxes 166 (1,224) 981
Net cash provided by operating activities 28,564 23,257 25,591
Cash ows from investing activities:
Payments for property and equipment (12,174) (13,115) (12,898)
Proceeds from the disposal of property and equipment 570 727 532
Proceeds from the disposal of certain operations 671 — —
Other investing activities (192) (138) (271)
Net cash used in investing activities (11,125) (12,526) (12,637)
Cash ows from nancing activities:
Net change in short-term borrowings (6,288) 911 2,754
Proceeds from issuance of long-term debt 5,174 7,072 211
Payments of long-term debt (3,904) (4,968) (1,478)
Dividends paid (6,185) (6,139) (5,361)
Purchase of Company stock (1,015) (6,683) (7,600)
Dividends paid to noncontrolling interest (600) (426) (282)
Purchase of noncontrolling interest (1,844) (296) (132)
Other financing activities (409) (260) (58)
Net cash used in financing activities (15,071) (10,789) (11,946)
Effect of exchange rates on cash and cash equivalents (514) (442) 223
Net increase (decrease) in cash and cash equivalents 1,854 (500) 1,231
Cash and cash equivalents at beginning of year 7,281 7,781 6,550
Cash and cash equivalents at end of year $ 9,135 $ 7,281 $ 7,781
Supplemental disclosure of cash ow information:
Income taxes paid 8,169 8,641 7,304
Interest paid 2,433 2,362 2,262
See accompanying notes.
Consolidated Statements of Cash Flows