Walmart 2015 Annual Report Download - page 29
Download and view the complete annual report
Please find page 29 of the 2015 Walmart annual report below. You can navigate through the pages in the report by either clicking on the pages listed below, or by using the keyword search tool below to find specific information within the annual report.-
 1
1 -
2
-
3
-
4
-
5
-
6
-
7
-
8
-
9
-
10
-
11
-
12
-
13
-
14
-
15
-
16
-
17
-
18
-
 19
19 -
 20
20 -
 21
21 -
 22
22 -
 23
23 -
 24
24 -
 25
25 -
 26
26 -
 27
27 -
 28
28 -
 29
29 -
 30
30 -
 31
31 -
 32
32 -
 33
33 -
 34
34 -
 35
35 -
 36
36 -
 37
37 -
 38
38 -
 39
39 -
40
-
41
-
42
-
43
-
44
-
45
-
46
-
47
-
48
-
49
-
50
-
51
-
52
-
53
-
54
-
55
-
56
-
57
-
58
-
59
-
60
-
61
-
62
-
63
-
64
-
65
-
66
-
67
-
68
 |
 |

27
2015 Annual Report
Management’s Discussion and Analysis of
Financial Condition and Results of Operations
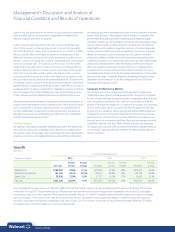
Net cash provided by operating activities was $28.6 billion, $23.3 billion
and $25.6 billion for fiscal 2015, 2014 and 2013, respectively. The increase
in net cash provided by operating activities for fiscal 2015, when
compared to the previous fiscal year, was primarily due to the timing
of payments for accounts payable and accrued liabilities, as well as the
timing of income tax payments. The decrease in cash flows provided by
operating activities in fiscal 2014, when compared to the previous fiscal
year, was primarily due to the timing of income tax payments, as well as
lower income from continuing operations.
During the first quarter of fiscal 2016, the Company announced a new
associate wage structure combined with comprehensive associate
training and educational programs. We anticipate cash flows provided
by operating activities will be sufficient to fund these programs.
Cash Equivalents and Working Capital
Cash and cash equivalents were $9.1 billion and $7.3 billion for fiscal 2015
and 2014, respectively. Our working capital deficit was $2.0 billion and
$8.2 billion at January 31, 2015 and 2014, respectively. The decrease in our
working capital deficit is primarily the result of using less of our net cash
provided by operating activities for share repurchases and capital
expenditures during fiscal 2015, which allowed us to reduce our short-
term borrowings. We generally operate with a working capital deficit
due to our efficient use of cash in funding operations, consistent access
to the capital markets and in providing returns to our shareholders in
the form of payments of cash dividends and share repurchases.
We use intercompany financing arrangements in an effort to ensure cash
can be made available in the country in which it is needed with the mini-
mum cost possible. We do not believe it will be necessary to repatriate
cash and cash equivalents held outside of the U.S. and anticipate our
domestic liquidity needs will be met through cash flows provided by
operating activities, supplemented with long-term debt and short-term
borrowings. Accordingly, we intend, with only certain exceptions, to
continue to indefinitely reinvest our cash and cash equivalents held
outside of the U.S. in our foreign operations. When the income earned,
either from operations or through intercompany financing arrangements,
and indefinitely reinvested outside of the U.S. is taxed at local country tax
rates, which are generally lower than the U.S. statutory rate, we realize an
effective tax rate benefit. If our intentions with respect to reinvestment
were to change, most of the amounts held within our foreign operations
could be repatriated to the U.S., although any repatriation under current
U.S. tax laws would be subject to U.S. federal income taxes, less applicable
foreign tax credits. As of January 31, 2015 and 2014, cash and cash
equivalents of approximately $1.7 billion and $1.9 billion, respectively,
may not be freely transferable to the U.S. due to local laws or other
restrictions. We do not expect local laws, other limitations or potential
taxes on anticipated future repatriations of cash amounts held outside
of the U.S. to have a material effect on our overall liquidity, financial
condition or results of operations.
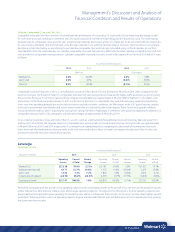
Net Cash Used in Investing Activities
Fiscal Years Ended January 31,
(Amounts in millions) 2015 2014 2013
Net cash used in
investing activities $(11,125) $(12,526) $(12,637)
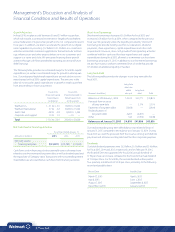
Net cash used in investing activities was $11.1 billion, $12.5 billion and
$12.6 billion for fiscal 2015, 2014 and 2013, respectively, and generally
consisted of payments to add stores, remodel numerous existing stores,
expand our digital retail capabilities and invest in other technologies.
Net cash used in investing activities decreased $1.4 billion for fiscal 2015,
when compared to the previous fiscal year, primarily due to lower
capital expenditures. The following table provides additional capital
expenditure detail:
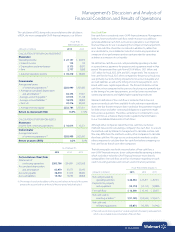
Allocation of Capital Expenditures
(Amounts in millions) Fiscal Years Ending January 31,
Capital Expenditures 2015 2014
New stores and clubs, including
expansions and relocations $ 4,128 $ 5,083
Information systems, distribution,
digital retail and other 3,288 2,539
Remodels 822 1,030
Total U.S. 8,238 8,652
Walmart International 3,936 4,463
Total capital expenditures $12,174 $13,115
Also reducing net cash used in investing activities were cash proceeds
of $671 million received from the sale of the Vips Restaurant Business in
Mexico (“Vips”) on May 12, 2014, which is further described in Note 13
to our Consolidated Financial Statements.
We continue to focus on striving to seamlessly integrate the digital and
physical shopping experience for our customers and expanded in digital
retail in each of our segments during fiscal 2015, with Walmart U.S. and
Sam’s Club focused on digital retail in the U.S. and Walmart International
focused on digital retail in countries outside of the U.S. Some of our fiscal
2015 accomplishments in this area were to successfully launch our new
web platform in the U.S., grow mobile and increase our third-party
marketplace offering.