Walmart 2015 Annual Report Download - page 25
Download and view the complete annual report
Please find page 25 of the 2015 Walmart annual report below. You can navigate through the pages in the report by either clicking on the pages listed below, or by using the keyword search tool below to find specific information within the annual report.-
 1
1 -
2
-
3
-
4
-
5
-
6
-
7
-
8
-
9
-
10
-
11
-
12
-
13
-
14
-
 15
15 -
 16
16 -
 17
17 -
 18
18 -
 19
19 -
 20
20 -
 21
21 -
 22
22 -
 23
23 -
 24
24 -
 25
25 -
 26
26 -
 27
27 -
 28
28 -
 29
29 -
 30
30 -
 31
31 -
 32
32 -
 33
33 -
 34
34 -
 35
35 -
36
-
37
-
38
-
39
-
40
-
41
-
42
-
43
-
44
-
45
-
46
-
47
-
48
-
49
-
50
-
51
-
52
-
53
-
54
-
55
-
56
-
57
-
58
-
59
-
60
-
61
-
62
-
63
-
64
-
65
-
66
-
67
-
68
 |
 |

23
2015 Annual Report
Management’s Discussion and Analysis of
Financial Condition and Results of Operations
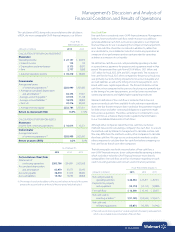
The calculation of ROI, along with a reconciliation to the calculation
of ROA, the most comparable GAAP financial measure, is as follows:
Fiscal Years
Ended January 31,
(Amounts in millions) 2015 2014
CALCULATION OF RETURN ON INVESTMENT
Numerator
Operating income $ 27,147 $ 26,872
+ Interest income 113 119
+ Depreciation and amortization 9,173 8,870
+ Rent 2,777 2,828
= Adjusted operating income $ 39,210 $ 38,689
Denominator
Average total assets
of continuing operations
(1)
$203,999 $203,680
+ Average accumulated depreciation
and amortization
(1)
63,375 57,907
- Average accounts payable
(1)
37,913 37,748
- Average accrued liabilities
(1)
18,973 18,802
+ Rent x 8 22,216 22,624
= Average invested capital $232,704 $227,661
Return on investment (ROI) 16.9% 17.0%
CALCULATION OF RETURN ON ASSETS
Numerator
Income from continuing operations $ 16,814 $ 16,551
Denominator
Average total assets
of continuing operations
(1)
$203,999 $203,680
Return on assets (ROA) 8.2% 8.1%
As of January 31,
2015 2014 2013
Certain Balance Sheet Data
Total assets of
continuing operations $203,706 $204,291 $203,068
Accumulated depreciation
and amortization 65,979 60,771 55,043
Accounts payable 38,410 37,415 38,080
Accrued liabilities 19,152 18,793 18,808
(1) The average is based on the addition of the account balance at the end of the current
period to the account balance at the end of the prior period and dividing by 2.
Free Cash Flow
Free cash flow is considered a non-GAAP financial measure. Management
believes, however, that free cash flow, which measures our ability to
generate additional cash from our business operations, is an important
financial measure for use in evaluating the Company’s financial perform-
ance. Free cash flow should be considered in addition to, rather than
as a substitute for, consolidated income from continuing operations as
a measure of our performance and net cash provided by operating
activities as a measure of our liquidity.
We define free cash flow as net cash provided by operating activities
in a period minus payments for property and equipment made in that
period. We generated free cash flow of $16.4 billion, $10.1 billion and
$12.7 billion for fiscal 2015, 2014 and 2013, respectively. The increase in
free cash flow for fiscal 2015, when compared to the previous fiscal year,
was primarily due to the timing of payments for accounts payable and
accrued liabilities, as well as the timing of income tax payments, com-
bined with lower capital expenditures. The fiscal 2014 decline in free
cash flow, when compared to the previous fiscal year, was primarily due
to the timing of income tax payments, as well as lower income from
continuing operations and slightly higher capital expenditures.
Walmart’s definition of free cash flow is limited in that it does not
represent residual cash flows available for discretionary expenditures
due to the fact that the measure does not deduct the payments required
for debt service and other contractual obligations or payments made
for business acquisitions. Therefore, we believe it is important to view
free cash flow as a measure that provides supplemental information
to our Consolidated Statements of Cash Flows.
Although other companies report their free cash flow, numerous
methods may exist for calculating a company’s free cash flow. As a result,
the method used by Walmart’s management to calculate our free cash
flow may differ from the methods used by other companies to calculate
their free cash flow. We urge you to understand the methods used by
other companies to calculate their free cash flow before comparing our
free cash flow to that of such other companies.
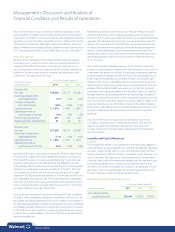
The following table sets forth a reconciliation of free cash flow, a
non-GAAP financial measure, to net cash provided by operating activities,
which we believe to be the GAAP financial measure most directly
comparable to free cash flow, as well as information regarding net cash
used in investing activities and net cash used in financing activities.
Fiscal Years Ended January 31,
(Amounts in millions) 2015 2014 2013
Net cash provided by
operating activities $ 28,564 $ 23,257 $ 25,591
Payments for property
and equipment (12,174) (13,115) (12,898)
Free cash flow $ 16,390 $ 10,142 $ 12,693
Net cash used in
investing activities
(1)
$(11,125) $(12,526) $(12,637)
Net cash used
in financing activities (15,071) (10,789) (11,946)
(1) “Net cash used in investing activities” includes payments for property and equipment,
which is also included in our computation of free cash flow.