Walmart 2015 Annual Report Download - page 30
Download and view the complete annual report
Please find page 30 of the 2015 Walmart annual report below. You can navigate through the pages in the report by either clicking on the pages listed below, or by using the keyword search tool below to find specific information within the annual report.-
 1
1 -
2
-
3
-
4
-
5
-
6
-
7
-
8
-
9
-
10
-
11
-
12
-
13
-
14
-
15
-
16
-
17
-
18
-
19
-
 20
20 -
 21
21 -
 22
22 -
 23
23 -
 24
24 -
 25
25 -
 26
26 -
 27
27 -
 28
28 -
 29
29 -
 30
30 -
 31
31 -
 32
32 -
 33
33 -
 34
34 -
 35
35 -
 36
36 -
 37
37 -
 38
38 -
 39
39 -
 40
40 -
41
-
42
-
43
-
44
-
45
-
46
-
47
-
48
-
49
-
50
-
51
-
52
-
53
-
54
-
55
-
56
-
57
-
58
-
59
-
60
-
61
-
62
-
63
-
64
-
65
-
66
-
67
-
68
 |
 |

28 2015 Annual Report
Management’s Discussion and Analysis of
Financial Condition and Results of Operations
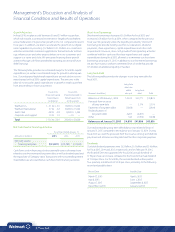
Growth Activities
In fiscal 2016, we plan to add between 26 and 30 million square feet,
which will include a continued investment in Neighborhood Markets
and a moderation of Supercenter growth in the U.S. compared to recent
fiscal years. In addition, we plan to accelerate the growth of our digital
retail capabilities by investing $1.2 billion to $1.5 billion in e-commerce
websites and mobile commerce applications that will include technol-
ogy, infrastructure and other areas to better serve our customers and
support our stores and clubs. We anticipate financing these growth
activities through cash flows provided by operating activities and future
debt financings.
The following table provides our estimated range for fiscal 2016 capital
expenditures, as well as our estimated range for growth in retail square
feet. Our anticipated digital retail expenditures are included in our esti-
mated range for fiscal 2016 capital expenditures. The amounts in the
table do not include capital expenditures or growth in retail square feet
from any pending or future acquisitions.
Fiscal 2016 Fiscal 2016
Projected Capital Projected Growth in
Expenditures Retail Square Feet
(in billions) (in thousands)
Walmart U.S. $ 6.1 to $ 6.6 15,000 to 16,000
Walmart International 3.7 to 4.2 10,000 to 13,000
Sam’s Club 0.8 to 0.8 1,000 to 1,000
Corporate and support 1.0 to 1.3 — to —
Total $11.6 to $12.9 26,000 to 30,000
Net Cash Used in Financing Activities
Fiscal Years Ended January 31,
(Amounts in millions) 2015 2014 2013
Net cash used in
financing activities $(15,071) $(10,789) $(11,946)
Cash flows used in financing activities generally consist of transactions
related to our short-term and long-term debt, as well as dividends paid and
the repurchase of Company stock. Transactions with noncontrolling interest
shareholders are also classified as cash flows from financing activities.
Short-term Borrowings
Short-term borrowings decreased $6.3 billion for fiscal 2015 and
increased $0.9 billion for fiscal 2014, when compared to the previous
fiscal year. We generally utilize the liquidity provided by short-term
borrowings to provide funding used for our operations, dividend
payments, share repurchases, capital expenditures and other cash
requirements. However, more cash provided from operating activities
combined with less cash used for share repurchases and capital
expenditures during fiscal 2015, allowed us to minimize our short-term
borrowings at January 31, 2015. In addition to our short-term borrowings,
we also have various undrawn committed lines of credit that provide
$15.0 billion of additional liquidity, if needed.
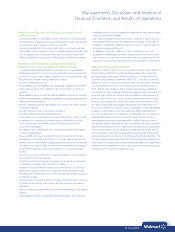
Long-term Debt
The following table provides the changes in our long-term debt for
fiscal 2015:
Long-term
debt due
within Long-term
(Amounts in millions) one year debt Total
Balances as of February 1, 2014 $ 4,103 $41,771 $45,874
Proceeds from issuance
of long-term debt — 5,174 5,174
Payments of long-term debt (3,904) — (3,904)
Reclassifications of
long-term debt 4,267 (4,267) —
Other 344 (1,592) (1,248)
Balances as of January 31, 2015 $ 4,810 $41,086 $45,896
Our total outstanding long-term debt balance was relatively flat as of
January 31, 2015 compared to the balance as of January 31, 2014. During
fiscal 2015, we used the proceeds from the issuance of long-term debt to
pay down and refinance existing debt and for other corporate purposes.
Dividends
Our total dividend payments were $6.2 billion, $6.1 billion and $5.4 billion
for fiscal 2015, 2014 and 2013, respectively, and on February 19, 2015,
the Board of Directors approved the fiscal 2016 annual dividend of
$1.96 per share, an increase compared to the fiscal 2015 annual dividend
of $1.92 per share. For fiscal 2016, the annual dividend will be paid in
four quarterly installments of $0.49 per share, according to the following
record and payable dates:
Record Date Payable Date
March 13, 2015 April 6, 2015
May 8, 2015 June 1, 2015
August 7, 2015 September 8, 2015
December 4, 2015 January 4, 2016