America Online 2015 Annual Report Download - page 11
Download and view the complete annual report
Please find page 11 of the 2015 America Online annual report below. You can navigate through the pages in the report by either clicking on the pages listed below, or by using the keyword search tool below to find specific information within the annual report.-
 1
1 -
 2
2 -
 3
3 -
 4
4 -
 5
5 -
 6
6 -
 7
7 -
 8
8 -
 9
9 -
 10
10 -
 11
11 -
 12
12 -
 13
13 -
 14
14 -
 15
15 -
 16
16 -
 17
17 -
 18
18 -
 19
19 -
 20
20 -
 21
21 -
 22
22 -
23
-
24
-
25
-
26
-
27
-
28
-
29
-
30
-
31
-
32
-
33
-
34
-
35
-
36
-
37
-
38
-
39
-
40
-
41
-
42
-
43
-
44
-
45
-
46
-
47
-
48
-
49
-
50
-
51
-
52
-
53
-
54
-
55
-
56
-
57
-
58
-
59
-
60
-
61
-
62
-
63
-
64
-
65
-
66
-
67
-
68
-
69
-
70
-
71
-
72
-
73
-
74
-
75
-
76
-
77
-
78
-
79
-
80
 |
 |
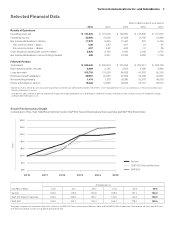
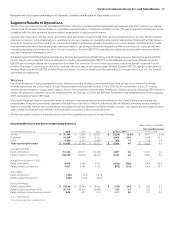
Selected Financial Data
(dollars in millions, except per share amounts)
2015 2014 2013 2012 2011
Results of Operations
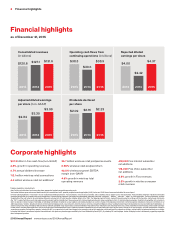
Operating revenues $ 131,620 $ 127,079 $ 120,550 $ 115,846 $ 110,875
Operating income 33,060 19,599 31,968 13,160 12,880
Net income attributable to Verizon 17,879 9,625 11,497 875 2,404
Per common share — basic 4.38 2.42 4.01 .31 .85
Per common share — diluted 4.37 2.42 4.00 .31 .85
Cash dividends declared per common share 2.230 2.160 2.090 2.030 1.975
Net income attributable to noncontrolling interests 496 2,331 12,050 9,682 7,794
Financial Position
Total assets $ 244,640 $ 232,616 $ 273,654 $ 222,911 $ 228,194
Debt maturing within one year 6,489 2,735 3,933 4,369 4,849
Long-term debt 103,705 110,536 89,658 47,618 50,303
Employee benet obligations 29,957 33,280 27,682 34,346 32,957
Noncontrolling interests 1,414 1,378 56,580 52,376 49,938
Equity attributable to Verizon 16,428 12,298 38,836 33,157 35,970
• Significant events affecting our historical earnings trends in 2013 through 2015 are described in “Other Items” in the “Management’s Discussion and Analysis of Financial Condition and
Results of Operations” section.
• 2012 data includes severance, pension and benefit charges, early debt redemption costs and litigation settlement charges. 2011 data includes severance, pension and benefit charges
and early debt redemption costs.
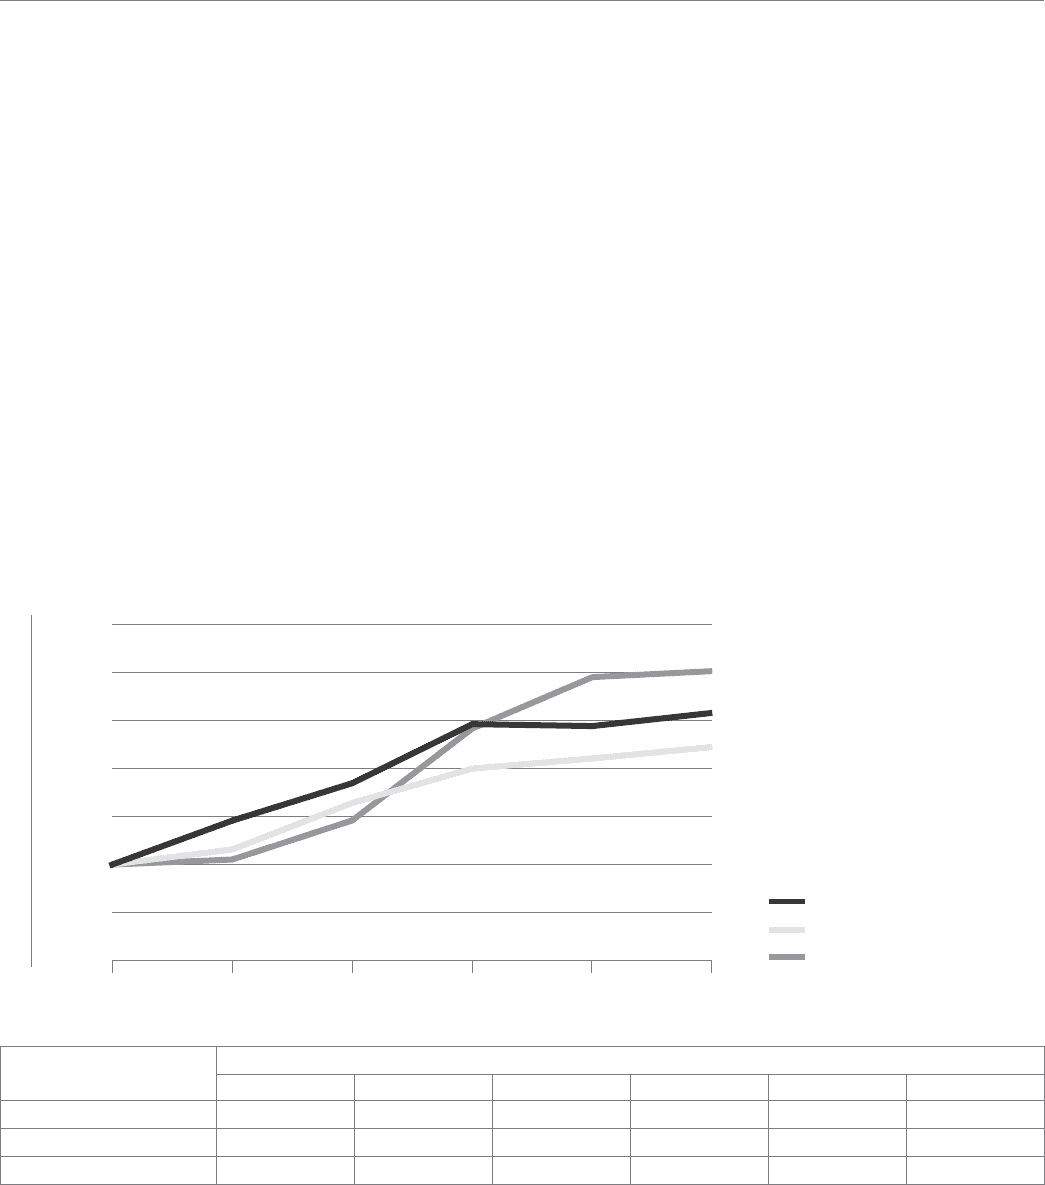
Stock Performance Graph
Comparison of Five-Year Total Return Among Verizon, S&P 500 Telecommunications Services Index and S&P 500 Stock Index
At December31,
Data Points in Dollars 2010 2011 2012 2013 2014 2015
Verizon 100.0 118.3 133.9 158.5 157.7 163.2
S&P 500 Telecom Services 100.0 106.3 125.7 140.0 144.2 149.0
S&P 500 100.0 102.1 118.4 156.7 178.1 180.6
The graph compares the cumulative total returns of Verizon, the S&P 500 Telecommunications Services Index, and the S&P 500 Stock Index over a five-year period. It assumes $100 was
invested on December 31, 2010 with dividends being reinvested.
2010 2011 2012 2013 2014 2015
$60
$80
$100
$120
$140
$160
$180
$200
Verizon
S&P 500 Telecom Services
S&P 500
Dollars
9Verizon Communications Inc. and Subsidiaries