America Online 2015 Annual Report Download - page 44
Download and view the complete annual report
Please find page 44 of the 2015 America Online annual report below. You can navigate through the pages in the report by either clicking on the pages listed below, or by using the keyword search tool below to find specific information within the annual report.-
 1
1 -
2
-
3
-
4
-
5
-
6
-
7
-
8
-
9
-
10
-
11
-
12
-
13
-
14
-
15
-
16
-
17
-
18
-
19
-
20
-
21
-
22
-
23
-
24
-
25
-
26
-
27
-
28
-
29
-
30
-
31
-
32
-
33
-
 34
34 -
 35
35 -
 36
36 -
 37
37 -
 38
38 -
 39
39 -
 40
40 -
 41
41 -
 42
42 -
 43
43 -
 44
44 -
 45
45 -
 46
46 -
 47
47 -
 48
48 -
 49
49 -
 50
50 -
 51
51 -
 52
52 -
 53
53 -
 54
54 -
55
-
56
-
57
-
58
-
59
-
60
-
61
-
62
-
63
-
64
-
65
-
66
-
67
-
68
-
69
-
70
-
71
-
72
-
73
-
74
-
75
-
76
-
77
-
78
-
79
-
80
 |
 |

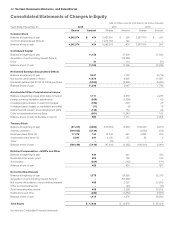
Consolidated Statements of Changes in Equity
(dollars in millions, except per share amounts, and shares in thousands)
Years Ended December31, 2015 2014 2013
Shares Amount Shares Amount Shares Amount
Common Stock
Balance at beginning of year 4,242,374 $ 424 2,967,610 $ 297 2,967,610 $ 297
Common shares issued (Note2) – – 1,274,764 127 – –
Balance at end of year 4,242,374 424 4,242,374 424 2,967,610 297
Contributed Capital
Balance at beginning of year 11,155 37,939 37,990
Acquisition of noncontrolling interest (Note2) – (26,898) –
Other 41 114 (51)
Balance at end of year 11,196 11,155 37,939
Reinvested Earnings (Accumulated Decit)
Balance at beginning of year 2,447 1,782 (3,734)
Net income attributable to Verizon 17,879 9,625 11,497
Dividends declared ($2.23, $2.16, $2.09) per share (9,080) (8,960) (5,981)
Balance at end of year 11,246 2,447 1,782
Accumulated Other Comprehensive Income
Balance at beginning of year attributable to Verizon 1,111 2,358 2,235
Foreign currency translation adjustments (208) (1,199) 60
Unrealized gains (losses) on cash ow hedges (194) (197) 25
Unrealized gains (losses) on marketable securities (11) (5) 16
Dened benet pension and postretirement plans (148) 154 22
Other comprehensive income (loss) (561) (1,247) 123
Balance at end of year attributable to Verizon 550 1,111 2,358
Treasury Stock
Balance at beginning of year (87,410) (3,263) (105,610) (3,961) (109,041) (4,071)
Shares purchased (104,402) (5,134) – – (3,500) (153)
Employee plans (Note15) 17,072 740 14,132 541 6,835 260
Shareowner plans (Note15) 5,541 241 4,105 157 96 3
Other – – (37) – – –
Balance at end of year (169,199) (7,416) (87,410) (3,263) (105,610) (3,961)
Deferred Compensation — ESOPs and Other
Balance at beginning of year 424 421 440
Restricted stock equity grant 208 166 152
Amortization (204) (163) (171)
Balance at end of year 428 424 421
Noncontrolling Interests
Balance at beginning of year 1,378 56,580 52,376
Acquisition of noncontrolling interest (Note2) – (55,960) –
Net income attributable to noncontrolling interests 496 2,331 12,050
Other comprehensive loss – (23) (15)
Total comprehensive income 496 2,308 12,035
Distributions and other (460) (1,550) (7,831)
Balance at end of year 1,414 1,378 56,580
Total Equity $ 17,842 $ 13,676 $ 95,416
See Notes to Consolidated Financial Statements
42 Verizon Communications Inc. and Subsidiaries