America Online 2015 Annual Report Download - page 70
Download and view the complete annual report
Please find page 70 of the 2015 America Online annual report below. You can navigate through the pages in the report by either clicking on the pages listed below, or by using the keyword search tool below to find specific information within the annual report.-
 1
1 -
2
-
3
-
4
-
5
-
6
-
7
-
8
-
9
-
10
-
11
-
12
-
13
-
14
-
15
-
16
-
17
-
18
-
19
-
20
-
21
-
22
-
23
-
24
-
25
-
26
-
27
-
28
-
29
-
30
-
31
-
32
-
33
-
34
-
35
-
36
-
37
-
38
-
39
-
40
-
41
-
42
-
43
-
44
-
45
-
46
-
47
-
48
-
49
-
50
-
51
-
52
-
53
-
54
-
55
-
56
-
57
-
58
-
59
-
 60
60 -
 61
61 -
 62
62 -
 63
63 -
 64
64 -
 65
65 -
 66
66 -
 67
67 -
 68
68 -
 69
69 -
 70
70 -
 71
71 -
 72
72 -
 73
73 -
 74
74 -
 75
75 -
 76
76 -
 77
77 -
 78
78 -
 79
79 -
 80
80
 |
 |

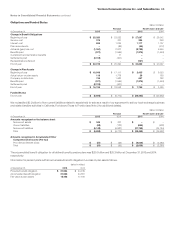
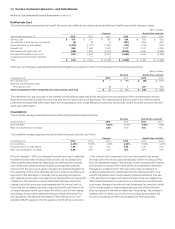
Health Care and Life Plans
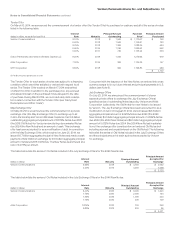
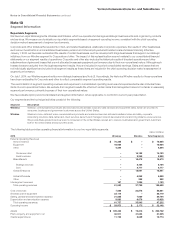
The fair values for the other postretirement benefit plans by asset
category at December31, 2015 are as follows:
(dollars in millions)
Asset Category Total Level 1 Level 2 Level 3
Cash and cash equivalents $ 162 $ 8 $ 154 $ –
Equity securities 974 752 222 –
Fixed income securities
U.S. Treasuries and agencies 21 18 3 –
Corporate bonds 524 133 391 –
International bonds 79 19 60 –
Other – – – –
Total $ 1,760 $ 930 $ 830 $ –
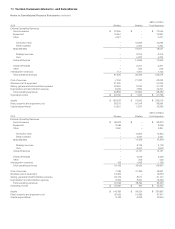
The fair values for the other postretirement benefit plans by asset
category at December31, 2014 are as follows:
(dollars in millions)
Asset Category Total Level 1 Level 2 Level 3
Cash and cash equivalents $ 208 $ 6 $ 202 $ –
Equity securities 1,434 1,172 262 –
Fixed income securities
U.S. Treasuries and agencies 105 98 7 –
Corporate bonds 461 119 296 46
International bonds 111 14 97 –
Other 116 – 116 –
Total $ 2,435 $ 1,409 $ 980 $ 46
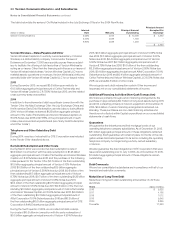
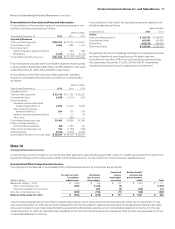
The following is a reconciliation of the beginning and ending balance of
the other postretirement benefit plans assets that are measured at fair
value using significant unobservable inputs:
(dollars in millions)
Corporate
Bonds Total
Balance at December31, 2013 $ – $ –
Actual gain on plan assets 1 1
Purchases and sales 45 45
Balance at December31, 2014 $ 46 $ 46
Transfers in (out) (46) (46)
Balance at December31, 2015 $ – $ –
The following are general descriptions of asset categories, as well
as the valuation methodologies and inputs used to determine the fair
value of each major category of assets.
Cash and cash equivalents include short-term investment funds,
primarily in diversified portfolios of investment grade money market
instruments and are valued using quoted market prices or other
valuation methods, and thus are classified within Level 1 or Level 2.
Equity securities are investments in common stock of domestic and
international corporations in a variety of industry sectors, and are
valued primarily using quoted market prices at the end of the reporting
period or other valuation methods based on observable inputs, and
thus are classified as Level 1 or Level 2. Investments not traded on a
national securities exchange use other valuation methods such as
pricing models or quoted prices of securities with similar characteris-
tics depending upon market activity and availability of quoted market
prices, and thus are classified as Level 3.
Fixed income securities include U.S. Treasuries and agencies, debt
obligations of foreign governments and domestic and foreign cor-
porations. Fixed income also includes investments in collateralized
mortgage obligations, mortgage backed securities and interest rate
swaps. The fair value of fixed income securities is based on observable
prices for identical or comparable assets, adjusted using benchmark
curves, sector grouping, matrix pricing, broker/dealer quotes and
issuer spreads, and thus are classified within Level 1 or Level 2.
Real estate investments include those in limited partnerships that
invest in various commercial and residential real estate projects both
domestically and internationally. The fair values of real estate assets
are typically determined by using income and/or cost approaches or
a comparable sales approach, taking into consideration discount and
capitalization rates, financial conditions, local market conditions and
the status of the capital markets, and thus are classified within Level 3.
Commingled funds, included within the Cash and cash equivalents,
Equity securities, Fixed income securities and Real estate investment
asset categories, are typically valued at net asset value (NAV) provided
by the fund administrator. NAV is the redemption value of the units held
at year end. As a practical expedient, management has determined
that NAV approximates fair value. These assets are categorized as
Level 2 or Level 3 depending upon liquidity.
Private equity investments include those in limited partnerships that
invest in operating companies that are not publicly traded on a stock
exchange. Investment strategies in private equity include leveraged
buyouts, venture capital, distressed investments and investments in
natural resources. These investments are valued using inputs such as
trading multiples of comparable public securities, merger and acqui-
sition activity and pricing data from the most recent equity financing
taking into consideration illiquidity, and thus are classified within
Level 3.
Hedge fund investments include those seeking to maximize absolute
returns using a broad range of strategies to enhance returns and
provide additional diversification. The fair values of hedge funds are
estimated using the NAV of the investments as a practical expedient.
Investments of this type for which Verizon has the ability to fully
redeem at NAV within the near term are classified within Level 2.
Investments that cannot be redeemed in the near term are classified
within Level 3.
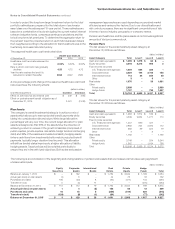
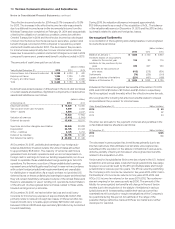
Employer Contributions
In 2015, we contributed $0.7billion to our qualified pension plans,
$0.1billion to our nonqualified pension plans and $0.9billion to our
other postretirement benefit plans. We anticipate a minimum contribu-
tion of $0.6billion to our qualified pension plans in 2016. Nonqualified
pension plans contributions are estimated to be $0.1billion and contri-
butions to our other postretirement benefit plans are estimated to be
$0.9billion in 2016.
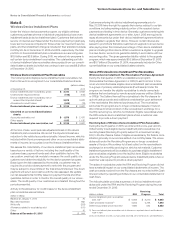
Estimated Future Benefit Payments
The benefit payments to retirees are expected to be paid as follows:
(dollars in millions)
Year Pension Benets Health Care and Life
2016 $ 1,906 $ 1,390
2017 1,757 1,390
2018 1,441 1,384
2019 1,391 1,354
2020 1,371 1,349
2021–2025 6,699 6,889
68 Verizon Communications Inc. and Subsidiaries
Notes to Consolidated Financial Statements continued