America Online 2015 Annual Report Download - page 24
Download and view the complete annual report
Please find page 24 of the 2015 America Online annual report below. You can navigate through the pages in the report by either clicking on the pages listed below, or by using the keyword search tool below to find specific information within the annual report.-
 1
1 -
2
-
3
-
4
-
5
-
6
-
7
-
8
-
9
-
10
-
11
-
12
-
13
-
 14
14 -
 15
15 -
 16
16 -
 17
17 -
 18
18 -
 19
19 -
 20
20 -
 21
21 -
 22
22 -
 23
23 -
 24
24 -
 25
25 -
 26
26 -
 27
27 -
 28
28 -
 29
29 -
 30
30 -
 31
31 -
 32
32 -
 33
33 -
 34
34 -
35
-
36
-
37
-
38
-
39
-
40
-
41
-
42
-
43
-
44
-
45
-
46
-
47
-
48
-
49
-
50
-
51
-
52
-
53
-
54
-
55
-
56
-
57
-
58
-
59
-
60
-
61
-
62
-
63
-
64
-
65
-
66
-
67
-
68
-
69
-
70
-
71
-
72
-
73
-
74
-
75
-
76
-
77
-
78
-
79
-
80
 |
 |

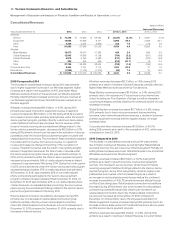
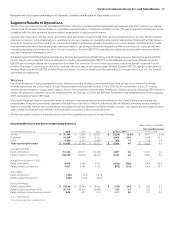
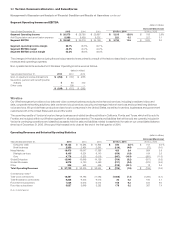
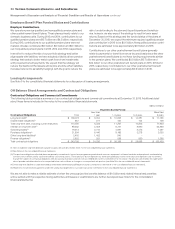
Segment Operating Income and EBITDA
(dollars in millions)
Increase/(Decrease)
Years Ended December31, 2015 2014 2013 2015 vs. 2014 2014 vs. 2013
Segment Operating Income $ 29,973 $ 26,760 $ 25,997 $ 3,213 12.0% $ 763 2.9%
Add Depreciation and amortization expense 8,980 8,459 8,202 521 6.2 257 3.1
Segment EBITDA $ 38,953 $ 35,219 $ 34,199 $ 3,734 10.6 $ 1,020 3.0
Segment operating income margin 32.7% 30.5% 32.1%
Segment EBITDA margin 42.5% 40.2% 42.2%
Segment EBITDA service margin 55.3% 48.5% 49.5%
The changes in the table above during the periods presented were primarily a result of the factors described in connection with operating
revenues and operating expenses.
Non- operational items excluded from Wireless’ Operating income were as follows:
(dollars in millions)
Years Ended December31, 2015 2014 2013
Gain on spectrum license transactions $ (254) $ (707) $ (278)
Severance, pension and benet (credits)
charges 5 86 (61)
Other costs – 109 –
$ (249) $ (512) $ (339)
Wireline
Our Wireline segment provides voice, data and video communications products and enhanced services, including broadband video and
data, corporate networking solutions, data center and cloud services, security and managed network services and local and long distance
voice services. We provide these products and services to consumers in the United States, as well as to carriers, businesses and government
customers both in the United States and around the world.
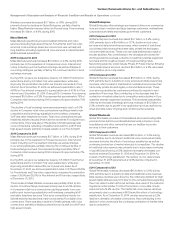
The operating results of Verizon’s local exchange business and related landline activities in California, Florida and Texas, which will be sold to
Frontier, are included within our Wireline segment for all periods presented. The assets and liabilities that will be sold are currently included in
Verizon’s continuing operations and classified as assets held for sale and liabilities related to assets held for sale on our consolidated balance
sheet as of December31, 2015. We expect this transaction to close at the end of the first quarter of 2016.
Operating Revenues and Selected Operating Statistics
(dollars in millions)
Increase/(Decrease)
Years Ended December31, 2015 2014 2013 2015 vs. 2014 2014 vs. 2013
Consumer retail $ 16,123 $ 15,583 $ 14,842 $ 540 3.5 % $ 741 5.0 %
Small business 2,350 2,464 2,541 (114) (4.6) (77) (3.0)
Mass Markets 18,473 18,047 17,383 426 2.4 664 3.8
Strategic services 8,165 8,324 8,140 (159) (1.9) 184 2.3
Core 4,778 5,325 6,016 (547) (10.3) (691) (11.5)
Global Enterprise 12,943 13,649 14,156 (706) (5.2) (507) (3.6)
Global Wholesale 5,979 6,190 6,560 (211) (3.4) (370) (5.6)
Other 325 543 525 (218) (40.1) 18 3.4
Total Operating Revenues $ 37,720 $ 38,429 $ 38,624 $ (709) (1.8) $ (195) (0.5)
Connections (’000):(1)
Total voice connections 18,387 19,795 21,085 (1,408) (7.1) (1,290) (6.1)
Total Broadband connections 9,228 9,205 9,015 23 0.2 190 2.1
Fios Internet subscribers 7,034 6,616 6,072 418 6.3 544 9.0
Fios video subscribers 5,827 5,649 5,262 178 3.2 387 7.4
(1) As of end of period
22 Verizon Communications Inc. and Subsidiaries
Management’s Discussion and Analysis ofFinancialCondition and Results of Operations continued