America Online 2015 Annual Report Download - page 18
Download and view the complete annual report
Please find page 18 of the 2015 America Online annual report below. You can navigate through the pages in the report by either clicking on the pages listed below, or by using the keyword search tool below to find specific information within the annual report.-
 1
1 -
2
-
3
-
4
-
5
-
6
-
7
-
 8
8 -
 9
9 -
 10
10 -
 11
11 -
 12
12 -
 13
13 -
 14
14 -
 15
15 -
 16
16 -
 17
17 -
 18
18 -
 19
19 -
 20
20 -
 21
21 -
 22
22 -
 23
23 -
 24
24 -
 25
25 -
 26
26 -
 27
27 -
 28
28 -
29
-
30
-
31
-
32
-
33
-
34
-
35
-
36
-
37
-
38
-
39
-
40
-
41
-
42
-
43
-
44
-
45
-
46
-
47
-
48
-
49
-
50
-
51
-
52
-
53
-
54
-
55
-
56
-
57
-
58
-
59
-
60
-
61
-
62
-
63
-
64
-
65
-
66
-
67
-
68
-
69
-
70
-
71
-
72
-
73
-
74
-
75
-
76
-
77
-
78
-
79
-
80
 |
 |

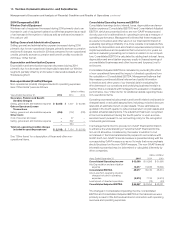
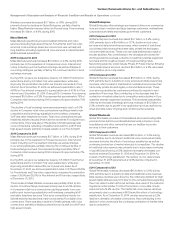
2014 Compared to 2013
Wireless Cost of Equipment
Wireless cost of equipment increased during 2014 primarily due to an
increase in cost of equipment sales at our Wireless segment as a result
of an increase in the number of devices sold as well as an increase in
the cost per unit.
Selling, General and Administrative Expense
Selling, general and administrative expense increased during 2014
primarily due to non- operational charges, primarily severance, pension
and benefit charges, recorded in 2014 as compared to non- operational
credits, primarily severance, pension and benefit credits, recorded in
2013 (see “Other Items”).
Depreciation and Amortization Expense
Depreciation and amortization expense decreased during 2014
primarily due to a decrease in net depreciable assets at our Wireline
segment, partially offset by an increase in depreciable assets at our
Wireless segment.
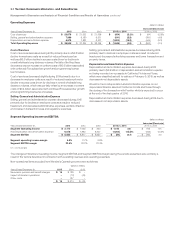
Non- operational (Credits) Charges
Non- operational (credits) charges included in operating expenses
(see“Other Items”) were as follows:
(dollars in millions)
Years Ended December31, 2015 2014 2013
Severance, Pension and Benet
(Credits) Charges
Selling, general and administrative expense $ (2,256) $ 7,507 $ (6,232)
Gain on Spectrum License
Transactions
Selling, general and administrative expense (254) (707) (278)
Other Costs
Cost of services and sales – 27 –
Selling, general and administrative expense – 307 –
– 334 –
Total non- operating (credits) charges
included in operating expenses $ (2,510) $ 7,134 $ (6,510)
See “Other Items” for a description of these and other non-
operational items.
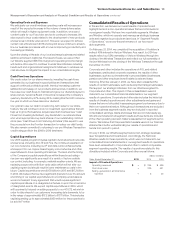
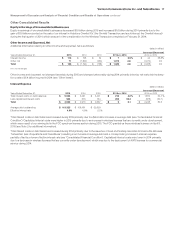
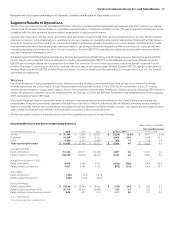
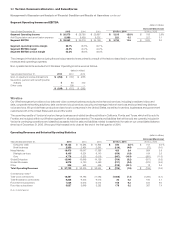
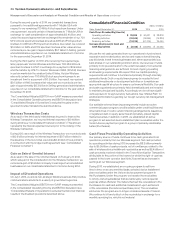
Consolidated Operating Income and EBITDA
Consolidated earnings before interest, taxes, depreciation and amor-
tization expenses (Consolidated EBITDA) and Consolidated Adjusted
EBITDA, which are presented below, are non-GAAP measures and
do not purport to be alternatives to operating income as a measure of
operating performance. Management believes that these measures
are useful to investors and other users of our financial information in
evaluating operating profitability on a more variable cost basis as they
exclude the depreciation and amortization expense related primarily to
capital expenditures and acquisitions that occurred in prior years, as
well as in evaluating operating performance in relation to our competi-
tors. Consolidated EBITDA is calculated by adding back interest, taxes,
depreciation and amortization expense, equity in (losses) earnings of
unconsolidated businesses and other income and (expense), net to
net income.
Consolidated Adjusted EBITDA is calculated by excluding the effect
of non- operational items and the impact of divested operations from
the calculation of Consolidated EBITDA. Management believes that
this measure provides additional relevant and useful information
to investors and other users of our financial data in evaluating the
effectiveness of our operations and underlying business trends in a
manner that is consistent with management’s evaluation of business
performance. See “Other Items” for additional details regarding these
non- operational items.
Operating expenses include pension and benefit related credits and/or
charges based on actuarial assumptions, including projected discount
rates and an estimated return on plan assets. These estimates are
updated in the fourth quarter to reflect actual return on plan assets and
updated actuarial assumptions. The adjustment has been recognized
in the income statement during the fourth quarter or upon a remea-
surement event pursuant to our accounting policy for the recognition
of actuarial gains/losses.
It is management’s intent to provide non-GAAP financial information
to enhance the understanding of Verizon’s GAAP financial informa-
tion, and it should be considered by the reader in addition to, but
not instead of, the financial statements prepared in accordance with
GAAP. Each non-GAAP financial measure is presented along with the
corresponding GAAP measure so as not to imply that more emphasis
should be placed on the non-GAAP measure. The non-GAAP financial
information presented may be determined or calculated differently by
other companies.
(dollars in millions)
Years Ended December31, 2015 2014 2013
Consolidated Operating Income $ 33,060 $ 19,599 $ 31,968
Add Depreciation and amortization
expense 16,017 16,533 16,606
Consolidated EBITDA 49,077 36,132 48,574
Add (Less) Non- operating (credits)
charges included in operating
expenses (2,510) 7,134 (6,510)
Less Impact of divested operations – (12) (43)
Consolidated Adjusted EBITDA $ 46,567 $ 43,254 $ 42,021
The changes in Consolidated Operating Income, Consolidated
EBITDA and Consolidated Adjusted EBITDA in the table above were
primarily a result of the factors described in connection with operating
revenues and operating expenses.
16 Verizon Communications Inc. and Subsidiaries
Management’s Discussion and Analysis ofFinancialCondition and Results of Operations continued