America Online 2015 Annual Report Download - page 26
Download and view the complete annual report
Please find page 26 of the 2015 America Online annual report below. You can navigate through the pages in the report by either clicking on the pages listed below, or by using the keyword search tool below to find specific information within the annual report.-
 1
1 -
2
-
3
-
4
-
5
-
6
-
7
-
8
-
9
-
10
-
11
-
12
-
13
-
14
-
15
-
 16
16 -
 17
17 -
 18
18 -
 19
19 -
 20
20 -
 21
21 -
 22
22 -
 23
23 -
 24
24 -
 25
25 -
 26
26 -
 27
27 -
 28
28 -
 29
29 -
 30
30 -
 31
31 -
 32
32 -
 33
33 -
 34
34 -
 35
35 -
 36
36 -
37
-
38
-
39
-
40
-
41
-
42
-
43
-
44
-
45
-
46
-
47
-
48
-
49
-
50
-
51
-
52
-
53
-
54
-
55
-
56
-
57
-
58
-
59
-
60
-
61
-
62
-
63
-
64
-
65
-
66
-
67
-
68
-
69
-
70
-
71
-
72
-
73
-
74
-
75
-
76
-
77
-
78
-
79
-
80
 |
 |

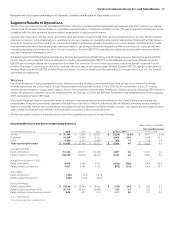
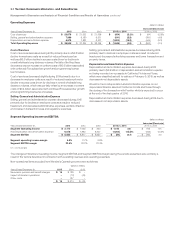
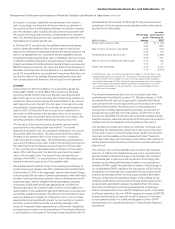
Operating Expenses
(dollars in millions)
Increase/(Decrease)
Years Ended December31, 2015 2014 2013 2015 vs. 2014 2014 vs. 2013
Cost of services $ 20,878 $ 21,332 $ 21,396 $ (454) (2.1)% $ (64) (0.3)%
Selling, general and administrative expense 7,989 8,180 8,571 (191) (2.3) (391) (4.6)
Depreciation and amortization expense 6,678 7,882 8,327 (1,204) (15.3) (445) (5.3)
Total Operating Expenses $ 35,545 $ 37,394 $ 38,294 $ (1,849) (4.9) $ (900) (2.4)
Cost of Services
Cost of services decreased during 2015 primarily due to a $0.3billion
decline in employee costs as a result of reduced headcount as
well as a $0.3billion decline in access costs driven by declines in
overall wholesale long distance volumes. Partially offsetting these
decreases was an increase in content costs of $0.5billion associated
with continued Fios subscriber growth and programming license
fee increases.
Cost of services decreased slightly during 2014 primarily due to a
decrease in employee costs as a result of reduced headcount and a
decline in access costs driven by declines in overall wholesale long
distance volumes, which was partially offset by an increase in content
costs of $0.4billion associated with continued Fios subscriber growth
and programming license fee increases.
Selling, General and Administrative Expense
Selling, general and administrative expense decreased during 2015
primarily due to declines in employee costs as a result of reduced
headcount and decreased administrative expenses, partially offset by
an increase in transaction taxes and regulatory expenses.
Selling, general and administrative expense decreased during 2014
primarily due to declines in employee costs as a result of reduced
headcount, decreased advertising expense and lower transaction and
property taxes.
Depreciation and Amortization Expense
Depreciation and amortization expense decreased during 2015
primarily due to $0.9billion of depreciation and amortization expense
not being recorded on our assets in California, Florida and Texas,
which were classified as held for sale as of February5, 2015, as well as
decreases in net depreciable assets.
We will not record depreciation and amortization expense on our
depreciable Wireline assets in California, Florida and Texas through
the closing of the transaction with Frontier, which is expected to occur
at the end of the first quarter of 2016.
Depreciation and amortization expense decreased during 2014 due to
decreases in net depreciable assets.
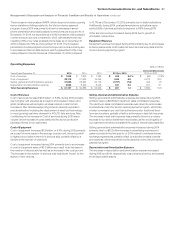
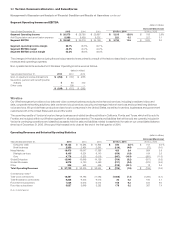
Segment Operating Income and EBITDA
(dollars in millions)
Increase/(Decrease)
Years Ended December31, 2015 2014 2013 2015 vs. 2014 2014 vs. 2013
Segment Operating Income $ 2,175 $ 1,035 $ 330 $ 1,140 nm $ 705 nm
Add Depreciation and amortization expense 6,678 7,882 8,327 (1,204) (15.3)% (445) (5.3)%
Segment EBITDA $ 8,853 $ 8,917 $ 8,657 $ (64) (0.7) $ 260 3.0
Segment operating income margin 5.8% 2.7% 0.9%
Segment EBITDA margin 23.5% 23.2% 22.4%
nm - not meaningful
The changes in Wireline’s Operating income, Segment EBITDA and Segment EBITDA margin during the periods presented were primarily a
result of the factors described in connection with operating revenues and operating expenses.
Non- operational items excluded from Wireline’s Operating income were as follows:
(dollars in millions)
Years Ended December31, 2015 2014 2013
Severance, pension and benet charges $ 15 $ 189 $ –
Impact of divested operations – (12) (43)
Other costs – 137 –
$ 15 $ 314 $ (43)
24 Verizon Communications Inc. and Subsidiaries
Management’s Discussion and Analysis ofFinancialCondition and Results of Operations continued