America Online 2015 Annual Report Download - page 17
Download and view the complete annual report
Please find page 17 of the 2015 America Online annual report below. You can navigate through the pages in the report by either clicking on the pages listed below, or by using the keyword search tool below to find specific information within the annual report.-
 1
1 -
2
-
3
-
4
-
5
-
6
-
 7
7 -
 8
8 -
 9
9 -
 10
10 -
 11
11 -
 12
12 -
 13
13 -
 14
14 -
 15
15 -
 16
16 -
 17
17 -
 18
18 -
 19
19 -
 20
20 -
 21
21 -
 22
22 -
 23
23 -
 24
24 -
 25
25 -
 26
26 -
 27
27 -
28
-
29
-
30
-
31
-
32
-
33
-
34
-
35
-
36
-
37
-
38
-
39
-
40
-
41
-
42
-
43
-
44
-
45
-
46
-
47
-
48
-
49
-
50
-
51
-
52
-
53
-
54
-
55
-
56
-
57
-
58
-
59
-
60
-
61
-
62
-
63
-
64
-
65
-
66
-
67
-
68
-
69
-
70
-
71
-
72
-
73
-
74
-
75
-
76
-
77
-
78
-
79
-
80
 |
 |

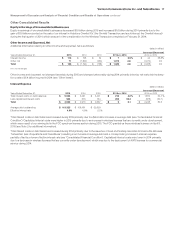
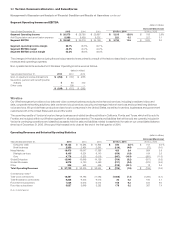
Wholesale, partially offset by higher Mass Markets revenues driven by
Fios services and increased Strategic services revenues within Global
Enterprise.
Mass Markets revenues increased $0.7billion, or 3.8%, during 2014
primarily due to the expansion of Fios services (voice, internet and
video), including our Fios Quantum offerings, as well as changes in
our pricing strategies, partially offset by the continued decline of local
exchange revenues.
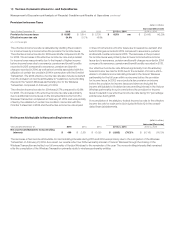
Global Enterprise revenues decreased $0.5billion, or 3.6%, during
2014 primarily due to lower voice services and data networking
revenues, the contraction of market rates due to competition and a
decline in Core customer premise equipment revenues. This decrease
was partially offset by an increase in Strategic services revenues,
primarily due to growth in our application services, such as our cloud
and data center offerings and contact center solutions.
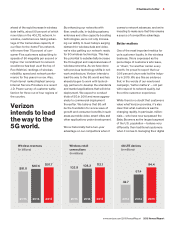
Global Wholesale revenues decreased $0.4billion, or 5.6%, during
2014 primarily due to a decline in data revenues driven by the
continuing demand for high-speed digital data services from fiber-
to-the-cell customers upgrading their core data circuits to Ethernet
facilities, as well as a decline in traditional voice revenues. During 2014,
we also experienced a decline in domestic wholesale connections.
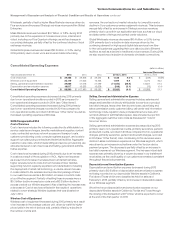
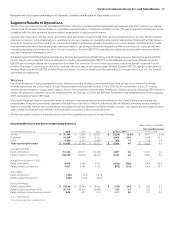
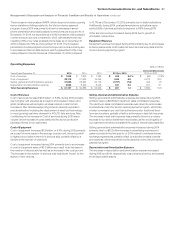
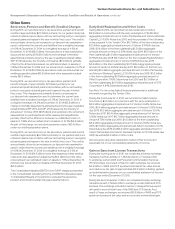
Consolidated Operating Expenses
(dollars in millions)
Increase/(Decrease)
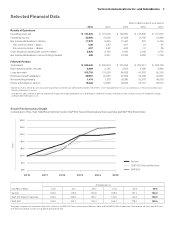
Years Ended December31, 2015 2014 2013 2015 vs. 2014 2014 vs. 2013
Cost of services $ 29,438 $ 28,306 $ 28,534 $ 1,132 4.0 % $ (228) (0.8)%
Wireless cost of equipment 23,119 21,625 16,353 1,494 6.9 5,272 32.2
Selling, general and administrative expense 29,986 41,016 27,089 (11,030) (26.9) 13,927 51.4
Depreciation and amortization expense 16,017 16,533 16,606 (516) (3.1) (73) (0.4)
Consolidated Operating Expenses $ 98,560 $ 107,480 $ 88,582 $ (8,920) (8.3) $ 18,898 21.3
Consolidated operating expenses decreased during 2015 primarily
due to non- operational credits recorded in 2015 as compared to
non- operational charges recorded in 2014 (see “Other Items”).
Consolidated operating expenses increased during 2014 primarily
due to non- operational charges recorded in 2014 as compared to
non- operational credits recorded in 2013 (see “Other Items”) as well as
increased operating expenses at Wireless.
2015 Compared to 2014
Cost of Services
Cost of services includes the following costs directly attributable to a
service: salaries and wages, benefits, materials and supplies, content
costs, contracted services, network access and transport costs,
customer provisioning costs, computer systems support, and costs to
support our outsourcing contracts and technical facilities. Aggregate
customer care costs, which include billing and service provisioning, are
allocated between Cost of services and Selling, general and adminis-
trative expense.
Cost of services increased during 2015 primarily due to an increase
in costs as a result of the acquisition of AOL, higher rent expense
as a result of an increase in wireless macro and small cell sites,
higher wireless network costs from an increase in fiber facilities
supporting network capacity expansion and densification, including
the deployment of small cell technology, a volume- driven increase
in costs related to the wireless device protection package offered
to our customers as well as a $0.5billion increase in content costs
at our Wireline segment. Partially offsetting these increases were a
$0.3billion decline in employee costs and a $0.3billion decline in
access costs at our Wireline segment. Also offsetting the increase was
a decrease in Cost of services reflected in the results of operations
related to a non- strategic Wireline business that was divested on
July1, 2014.
Wireless Cost of Equipment
Wireless cost of equipment increased during 2015 primarily as a result
of an increase in the average cost per unit, driven by a shift to higher
priced units in the mix of devices sold, partially offset by a decline in
the number of units sold.
Selling, General and Administrative Expense
Selling, general and administrative expense includes: salaries and
wages and benefits not directly attributable to a service or product,
bad debt charges, taxes other than income taxes, advertising and
sales commission costs, customer billing, call center and information
technology costs, regulatory fees, professional service fees, and
rent and utilities for administrative space. Also included is a portion
of the aggregate customer care costs as discussed in “Cost of
Services” above.
Selling, general and administrative expense decreased during 2015
primarily due to non- operational credits, primarily severance, pension
and benefit credits, recorded in 2015 as compared to non- operational
charges, primarily severance, pension and benefit charges, recorded
in 2014 (see “Other Items”). Also contributing to this decrease was a
decline in sales commission expense at our Wireless segment, which
was driven by an increase in activations under the Verizon device
payment program. The decrease is partially offset by an increase in
bad debt expense at our Wireless segment. The increase in bad debt
expense was primarily driven by a volume increase in our installment
receivables, as the credit quality of our customers remained consistent
throughout the periods presented.
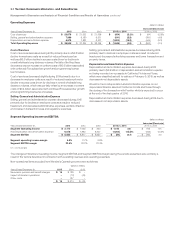
Depreciation and Amortization Expense
Depreciation and amortization expense decreased during 2015
primarily due to $0.9billion of depreciation and amortization expense
not being recorded on our depreciable Wireline assets in California,
Florida and Texas which were classified as held for sale as of
February5, 2015, partially offset by an increase in depreciable assets
at our Wireless segment.
We will not record depreciation and amortization expense on our
depreciable Wireline assets in California, Florida and Texas through
the closing of the transaction with Frontier, which is expected to occur
at the end of the first quarter of 2016.
15Verizon Communications Inc. and Subsidiaries
Management’s Discussion and Analysis ofFinancialCondition and Results of Operations continued