America Online 2015 Annual Report Download - page 43
Download and view the complete annual report
Please find page 43 of the 2015 America Online annual report below. You can navigate through the pages in the report by either clicking on the pages listed below, or by using the keyword search tool below to find specific information within the annual report.-
 1
1 -
2
-
3
-
4
-
5
-
6
-
7
-
8
-
9
-
10
-
11
-
12
-
13
-
14
-
15
-
16
-
17
-
18
-
19
-
20
-
21
-
22
-
23
-
24
-
25
-
26
-
27
-
28
-
29
-
30
-
31
-
32
-
 33
33 -
 34
34 -
 35
35 -
 36
36 -
 37
37 -
 38
38 -
 39
39 -
 40
40 -
 41
41 -
 42
42 -
 43
43 -
 44
44 -
 45
45 -
 46
46 -
 47
47 -
 48
48 -
 49
49 -
 50
50 -
 51
51 -
 52
52 -
 53
53 -
54
-
55
-
56
-
57
-
58
-
59
-
60
-
61
-
62
-
63
-
64
-
65
-
66
-
67
-
68
-
69
-
70
-
71
-
72
-
73
-
74
-
75
-
76
-
77
-
78
-
79
-
80
 |
 |

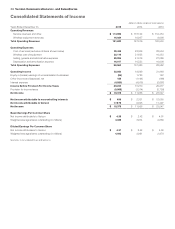
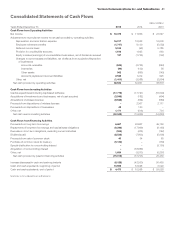
Consolidated Statements of Cash Flows
(dollars in millions)
Years Ended December31, 2015 2014 2013
Cash Flows from Operating Activities
Net Income $ 18,375 $ 11,956 $ 23,547
Adjustments to reconcile net income to net cash provided by operating activities:
Depreciation and amortization expense 16,017 16,533 16,606
Employee retirement benets (1,747) 8,130 (5,052)
Deferred income taxes 3,516 (92) 5,785
Provision for uncollectible accounts 1,610 1,095 993
Equity in losses (earnings) of unconsolidated businesses, net of dividends received 127 (1,743) (102)
Changes in current assets and liabilities, net of effects from acquisition/disposition
ofbusinesses
Accounts receivable (945) (2,745) (843)
Inventories (99) (132) 56
Other assets 942 (695) (143)
Accounts payable and accrued liabilities 2,545 1,412 925
Other, net (1,411) (3,088) (2,954)
Net cash provided by operating activities 38,930 30,631 38,818
Cash Flows from Investing Activities
Capital expenditures (including capitalized software) (17,775) (17,191) (16,604)
Acquisitions of investments and businesses, net of cash acquired (3,545) (182) (494)
Acquisitions of wireless licenses (9,942) (354) (580)
Proceeds from dispositions of wireless licenses – 2,367 2,111
Proceeds from dispositions of businesses 48 120 –
Other, net 1,171 (616) 734
Net cash used in investing activities (30,043) (15,856) (14,833)
Cash Flows from Financing Activities
Proceeds from long-term borrowings 6,667 30,967 49,166
Repayments of long-term borrowings and capital lease obligations (9,340) (17,669) (8,163)
Decrease in short-term obligations, excluding current maturities (344) (475) (142)
Dividends paid (8,538) (7,803) (5,936)
Proceeds from sale of common stock 40 34 85
Purchase of common stock for treasury (5,134) – (153)
Special distribution to noncontrolling interest – – (3,150)
Acquisition of noncontrolling interest – (58,886) –
Other, net 1,634 (3,873) (5,257)
Net cash provided by (used in) nancing activities (15,015) (57,705) 26,450
Increase (decrease) in cash and cash equivalents (6,128) (42,930) 50,435
Cash and cash equivalents, beginning of period 10,598 53,528 3,093
Cash and cash equivalents, end of period $ 4,470 $ 10,598 $ 53,528
See Notes to Consolidated Financial Statements
41Verizon Communications Inc. and Subsidiaries