America Online 2015 Annual Report Download - page 16
Download and view the complete annual report
Please find page 16 of the 2015 America Online annual report below. You can navigate through the pages in the report by either clicking on the pages listed below, or by using the keyword search tool below to find specific information within the annual report.-
 1
1 -
2
-
3
-
4
-
5
-
 6
6 -
 7
7 -
 8
8 -
 9
9 -
 10
10 -
 11
11 -
 12
12 -
 13
13 -
 14
14 -
 15
15 -
 16
16 -
 17
17 -
 18
18 -
 19
19 -
 20
20 -
 21
21 -
 22
22 -
 23
23 -
 24
24 -
 25
25 -
 26
26 -
27
-
28
-
29
-
30
-
31
-
32
-
33
-
34
-
35
-
36
-
37
-
38
-
39
-
40
-
41
-
42
-
43
-
44
-
45
-
46
-
47
-
48
-
49
-
50
-
51
-
52
-
53
-
54
-
55
-
56
-
57
-
58
-
59
-
60
-
61
-
62
-
63
-
64
-
65
-
66
-
67
-
68
-
69
-
70
-
71
-
72
-
73
-
74
-
75
-
76
-
77
-
78
-
79
-
80
 |
 |

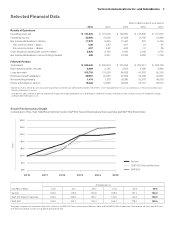
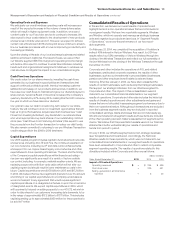
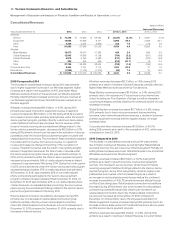
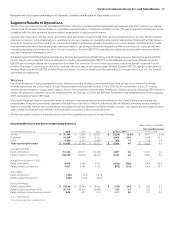
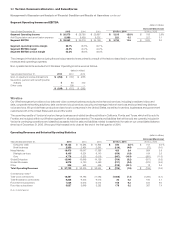
Consolidated Revenues
(dollars in millions)
Increase/(Decrease)
Years Ended December31, 2015 2014 2013 2015 vs. 2014 2014 vs. 2013
Wireless
Service $ 70,396 $ 72,630 $ 69,033 $ (2,234) (3.1)% $ 3,597 5.2 %
Equipment 16,924 10,959 8,111 5,965 54.4 2,848 35.1
Other 4,360 4,057 3,879 303 7.5 178 4.6
Total 91,680 87,646 81,023 4,034 4.6 6,623 8.2
Wireline
Mass Markets 18,473 18,047 17,383 426 2.4 664 3.8
Global Enterprise 12,943 13,649 14,156 (706) (5.2) (507) (3.6)
Global Wholesale 5,979 6,190 6,560 (211) (3.4) (370) (5.6)
Other 325 543 525 (218) (40.1) 18 3.4
Total 37,720 38,429 38,624 (709) (1.8) (195) (0.5)
Corporate and other 3,444 2,144 2,113 1,300 60.6 31 1.5
Eliminations (1,224) (1,140) (1,210) (84) 7.4 70 (5.8)
Consolidated Revenues $ 131,620 $ 127,079 $ 120,550 $ 4,541 3.6 $ 6,529 5.4
2015 Compared to 2014
The increase in consolidated revenues during 2015 was primarily
due to higher equipment revenues in our Wireless segment, higher
revenues as a result of the acquisition of AOL and higher Mass
Markets revenues driven by Fios services at our Wireline segment.
Partially offsetting these increases were lower Service revenues at
our Wireless segment and lower Global Enterprise revenues at our
Wireline segment.
Wireless’ revenues increased $4.0billion, or 4.6%, during 2015
primarily as a result of growth in equipment revenue. Equipment
revenue increased by $6.0billion, or 54.4% during 2015 as a result of
an increase in device sales, primarily smartphones, under the Verizon
device payment program, partially offset by a decline in device sales
under traditional fixed-term service plans. Service revenue, which
does not include recurring device installment billings related to the
Verizon device payment program, decreased by $2.2billion, or 3.1%,
during 2015 primarily driven by an increase in the activation of devices
purchased under the Verizon device payment program on plans with
unsubsidized service pricing. The increase in these activations resulted
in a relative shift of revenue from service revenue to equipment
revenue and caused a change in the timing of the recognition of
revenue. This shift in revenue was the result of recognizing a higher
amount of equipment revenue at the time of sale of devices under
the device payment program. During the year ended December31,
2015, phone activations under the Verizon device payment program
represented approximately 54% of retail postpaid phones activated
compared to approximately 18% during 2014. During the fourth quarter
of 2015, phone activations under the Verizon device payment program
represented approximately 67% of retail postpaid phones activated.
At December31, 2015, approximately 29% of our retail postpaid
phone connections participated in the Verizon device payment
program compared to approximately 8% at December31, 2014. At
December31, 2015, approximately 42% of our retail postpaid phone
connections were on unsubsidized service pricing. Service revenue
plus recurring device installment billings related to the Verizon device
payment program increased 2.0% during 2015.
Retail postpaid connection net additions decreased during 2015
primarily due to a decrease in retail postpaid connection gross
additions, partially offset by a lower retail postpaid connection
churn rate. Retail postpaid connections per account increased as of
December31, 2015 compared to December31, 2014, primarily due to
increases in Internet devices.
Wireline’s revenues decreased $0.7billion, or 1.8%, during 2015
primarily as a result of declines in Global Enterprise, partially offset by
higher Mass Markets revenues driven by Fios services.
Mass Markets revenues increased $0.4billion, or 2.4%, during 2015
primarily due to the expansion of Fios services (voice, internet and
video), including our Fios Quantum offerings, as well as changes in
our pricing strategies, partially offset by the continued decline of local
exchange revenues.
Global Enterprise revenues decreased $0.7billion, or 5.2%, during
2015 primarily due to lower voice services and data networking
revenues, lower networking solutions revenues, a decline in customer
premise equipment revenues and the negative impact of foreign
exchange rates.
Corporate and other revenues increased $1.3billion, or 60.6%,
during 2015 primarily as a result of the acquisition of AOL, which was
completed on June23, 2015.
2014 Compared to 2013
The increase in consolidated revenues during 2014 was primarily
due to higher revenues at Wireless, as well as higher Mass Markets
revenues driven by Fios services at our Wireline segment. Partially off-
setting these increases were lower Global Enterprise Core and Global
Wholesale revenues at our Wireline segment.
Wireless’ revenues increased $6.6billion, or 8.2%, during 2014
primarily as a result of growth in service revenue and equipment
revenue. The increase in service revenue, which does not include
recurring equipment installment billings related to the Verizon device
payment program, during 2014 was primarily driven by higher retail
postpaid service revenue, which increased largely as a result of
an increase in retail postpaid connections as well as the continued
increase in penetration of 4G LTE smartphones and tablets through
our More Everything plans. Retail postpaid connection net additions
increased during 2014 primarily due to an increase in retail postpaid
connection gross additions partially offset by an increase in our
retail postpaid connection churn rate. Retail postpaid connections
per account increased as of December31, 2015 compared to
December31, 2014 primarily due to the increased penetration of
tablets. Equipment revenue increased during 2014 primarily due to an
increase in device sales under both traditional fixed-term service plans
and the Verizon device payment program.
Wireline’s revenues decreased $0.2billion, or 0.5%, during 2014
primarily as a result of declines in Global Enterprise Core and Global
14 Verizon Communications Inc. and Subsidiaries
Management’s Discussion and Analysis ofFinancialCondition and Results of Operations continued