America Online 2015 Annual Report Download - page 64
Download and view the complete annual report
Please find page 64 of the 2015 America Online annual report below. You can navigate through the pages in the report by either clicking on the pages listed below, or by using the keyword search tool below to find specific information within the annual report.-
 1
1 -
2
-
3
-
4
-
5
-
6
-
7
-
8
-
9
-
10
-
11
-
12
-
13
-
14
-
15
-
16
-
17
-
18
-
19
-
20
-
21
-
22
-
23
-
24
-
25
-
26
-
27
-
28
-
29
-
30
-
31
-
32
-
33
-
34
-
35
-
36
-
37
-
38
-
39
-
40
-
41
-
42
-
43
-
44
-
45
-
46
-
47
-
48
-
49
-
50
-
51
-
52
-
53
-
 54
54 -
 55
55 -
 56
56 -
 57
57 -
 58
58 -
 59
59 -
 60
60 -
 61
61 -
 62
62 -
 63
63 -
 64
64 -
 65
65 -
 66
66 -
 67
67 -
 68
68 -
 69
69 -
 70
70 -
 71
71 -
 72
72 -
 73
73 -
 74
74 -
75
-
76
-
77
-
78
-
79
-
80
 |
 |

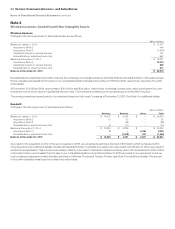
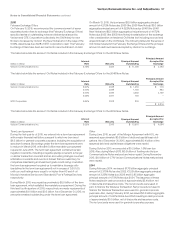
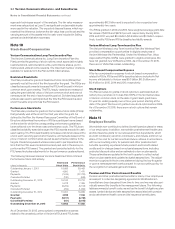
Variable Interest Entities
Under both the RPA and the Revolving Program, the SPE’s sole
business consists of the acquisition of the receivables from Verizon and
the resale of the receivables to the Purchasers. The assets of the SPEs
are not available to be used to satisfy obligations of any Verizon entities
other than the Sellers. We determined that the SPEs are VIEs as they
lack sufficient equity to finance their activities. Given that we have the
power to direct the activities of the SPEs that most significantly impact
the SPE’s economic performance, we are deemed to be the primary
beneficiary of the SPEs. As a result, we consolidate the assets and lia-
bilities of the SPEs into our consolidated financial statements.
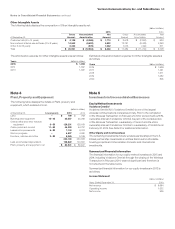
Deferred Purchase Price
Under both the RPA and the Revolving Program, the deferred
purchase price was initially recorded at fair value, based on the
remaining installment amounts expected to be collected, adjusted, as
applicable, for the time value of money and by the timing and estimated
value of the device trade-in. The estimated value of the device trade-in
considers prices expected to be offered to us by independent third
parties. This estimate contemplates changes in value after the launch
of a device. The fair value measurements are considered to be Level
3 measurements within the fair value hierarchy. The collection of the
deferred purchase price is contingent on collections from customers.
At December31, 2015, our deferred purchase price receivable was
$2.2billion, which is held by the SPEs and is included within Other
assets on our consolidated balance sheet.
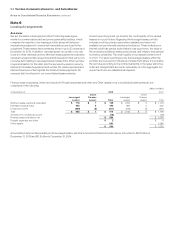
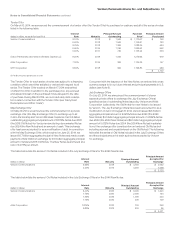
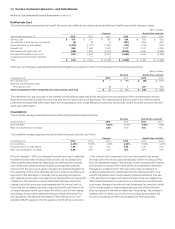
Continuing Involvement
Verizon has continuing involvement with the sold receivables as it
services the receivables. We continue to service the customer and
their related receivables, including facilitating customer payment
collection, in exchange for a monthly servicing fee. While servicing
the receivables, the same policies and procedures are applied to the
sold receivables that apply to owned receivables, and we continue to
maintain normal relationships with our customers. The credit quality
of the customers we continue to service is consistent throughout the
periods presented. During the year ended December31, 2015, we have
collected and remitted approximately $1.3billion, net of fees, of which
an immaterial amount was returned as deferred purchase price. During
the year ended December31, 2015, credit losses on receivables sold
were an immaterial amount.
In addition, we have continuing involvement related to the sold
receivables as we may be responsible for absorbing additional
credit losses pursuant to the agreements. The Company’s maximum
exposure to loss related to the involvement with the SPEs is limited
to the amount of the deferred purchase price, which was $2.2billion
as of December31, 2015. The maximum exposure to loss represents
an estimated loss that would be incurred under severe, hypothetical
circumstances whereby the Company would not receive the portion of
the proceeds withheld by the Purchasers. As we believe the probability
of these circumstances occurring is remote, the maximum exposure to
loss is not an indication of the Company’s expected loss.
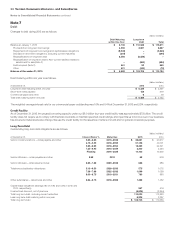
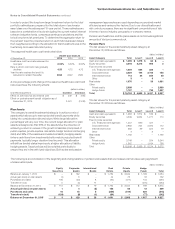
Note9
Fair Value Measurements and Financial Instruments
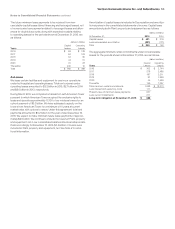
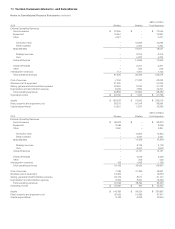
Recurring Fair Value Measurements
The following table presents the balances of assets and liabilities
measured at fair value on a recurring basis as of December31, 2015:
(dollars in millions)
Level 1(1) Level 2(2) Level 3(3) Total
Assets:
Short-term investments:
Equity securities $ 265 $ – $ – $ 265
Fixed income securities – 85 – 85
Other current assets:
Fixed income securities 250 – – 250
Other assets:
Fixed income securities – 928 – 928
Interest rate swaps – 128 – 128
Net investment hedges – 13 – 13
Cross currency swaps – 1 – 1
Total $ 515 $ 1,155 $ – $ 1,670
Liabilities:
Other liabilities:
Interest rate swaps $ – $ 19 $ – $ 19
Cross currency swaps – 1,638 – 1,638
Forward interest rate swaps – 24 – 24
Total $ – $ 1,681 $ – $ 1,681
(1) quoted prices in active markets for identical assets or liabilities
(2) observable inputs other than quoted prices in active markets for identical assets and
liabilities
(3) no observable pricing inputs in the market
Equity securities consist of investments in common stock of domestic
and international corporations measured using quoted prices in
active markets.
Fixed income securities consist primarily of investments in municipal
bonds as well as U.S. Treasury securities. We use quoted prices in
active markets for our U.S. Treasury securities, therefore these secu-
rities are classified as Level 1. For all other fixed income securities that
do not have quoted prices in active markets, we use alternative matrix
pricing resulting in these debt securities being classified as Level 2.
Derivative contracts are valued using models based on readily observ-
able market parameters for all substantial terms of our derivative
contracts and thus are classified within Level 2. We use mid- market
pricing for fair value measurements of our derivative instruments. Our
derivative instruments are recorded on a gross basis.
We recognize transfers between levels of the fair value hierarchy as of
the end of the reporting period. There were no transfers within the fair
value hierarchy during 2015.
62 Verizon Communications Inc. and Subsidiaries
Notes to Consolidated Financial Statements continued