America Online 2015 Annual Report Download - page 77
Download and view the complete annual report
Please find page 77 of the 2015 America Online annual report below. You can navigate through the pages in the report by either clicking on the pages listed below, or by using the keyword search tool below to find specific information within the annual report.-
 1
1 -
2
-
3
-
4
-
5
-
6
-
7
-
8
-
9
-
10
-
11
-
12
-
13
-
14
-
15
-
16
-
17
-
18
-
19
-
20
-
21
-
22
-
23
-
24
-
25
-
26
-
27
-
28
-
29
-
30
-
31
-
32
-
33
-
34
-
35
-
36
-
37
-
38
-
39
-
40
-
41
-
42
-
43
-
44
-
45
-
46
-
47
-
48
-
49
-
50
-
51
-
52
-
53
-
54
-
55
-
56
-
57
-
58
-
59
-
60
-
61
-
62
-
63
-
64
-
65
-
66
-
 67
67 -
 68
68 -
 69
69 -
 70
70 -
 71
71 -
 72
72 -
 73
73 -
 74
74 -
 75
75 -
 76
76 -
 77
77 -
 78
78 -
 79
79 -
 80
80
 |
 |

have sold products and seek injunctive relief as well. These cases have
progressed to various stages and a small number may go to trial in the
coming 12 months if they are not otherwise resolved.
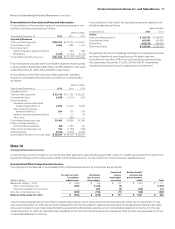
In connection with the execution of agreements for the sales of busi-
nesses and investments, Verizon ordinarily provides representations
and warranties to the purchasers pertaining to a variety of nonfinancial
matters, such as ownership of the securities being sold, as well as
indemnity from certain financial losses. From time to time, counterparties
may make claims under these provisions, and Verizon will seek to defend
against those claims and resolve them in the ordinary course of business.
Subsequent to the sale of Verizon Information Services Canada in
2004, we continue to provide a guarantee to publish directories, which
was issued when the directory business was purchased in 2001 and
had a 30-year term (before extensions). The preexisting guarantee
continues, without modification, despite the subsequent sale of
Verizon Information Services Canada and the spin-off of our domestic
print and Internet yellow pages directories business. The possible
financial impact of the guarantee, which is not expected to be adverse,
cannot be reasonably estimated as a variety of the potential outcomes
available under the guarantee result in costs and revenues or benefits
that may offset each other. We do not believe performance under the
guarantee is likely.
As of December31, 2015, letters of credit totaling approximately
$0.1billion, which were executed in the normal course of business and
support several financing arrangements and payment obligations to
third parties, were outstanding.
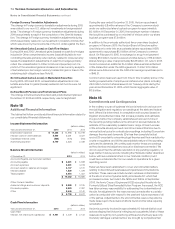
We have several commitments primarily to purchase programming and
network services, equipment, software, handsets and peripherals, and
marketing activities, which will be used or sold in the ordinary course of
business, from a variety of suppliers totaling $21.9billion. Of this total
amount, $8.4billion is attributable to 2016, $9.2billion is attributable
to 2017 through 2018, $2.3billion is attributable to 2019 through 2020
and $2.0billion is attributable to years thereafter. These amounts
do not represent our entire anticipated purchases in the future, but
represent only those items that are the subject of contractual obli-
gations. Our commitments are generally determined based on the
noncancelable quantities or termination amounts. Purchases against
our commitments for 2015 totaled approximately $10.2billion. Since
the commitments to purchase programming services from television
networks and broadcast stations have no minimum volume require-
ment, we estimated our obligation based on number of subscribers at
December31, 2015, and applicable rates stipulated in the contracts in
effect at that time. We also purchase products and services as needed
with no firm commitment.
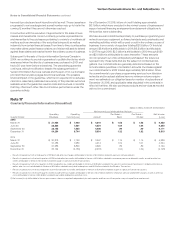
Note17
Quarterly Financial Information (Unaudited)
(dollars in millions, except per share amounts)
Net Income (Loss) attributable to Verizon(1)
Quarter Ended
Operating
Revenues
Operating
Income (Loss) Amount
Per Share —
Basic
Per Share —
Diluted
Net Income
(Loss)
2015
March 31 $ 31,984 $ 7,960 $ 4,219 $ 1.03 $ 1.02 $ 4,338
June 30 32,224 7,821 4,231 1.04 1.04 4,353
September 30 33,158 7,535 4,038 .99 .99 4,171
December 31 34,254 9,744 5,391 1.32 1.32 5,513
2014
March 31 $ 30,818 $ 7,160 $ 3,947 $ 1.15 $ 1.15 $ 5,986
June 30 31,483 7,685 4,214 1.02 1.01 4,324
September 30 31,586 6,890 3,695 .89 .89 3,794
December 31 33,192 (2,136) (2,231) (.54) (.54) (2,148)
• Results of operations for the third quarter of 2015 include after-tax charges attributable to Verizon of $0.2billion related to a pension remeasurement.
• Results of operations for the fourth quarter of 2015 include after-tax credits attributable to Verizon of $1.6billion related to severance, pension and benefit credits, as well as after-tax
credits attributable to Verizon of $0.2billion related to a gain on spectrum license transactions.
• Results of operations for the first quarter of 2014 include after-tax- credits attributable to Verizon of $1.9billion related to the sale of its entire ownership interest in Vodafone Omnitel, as
well as after-tax costs attributable to Verizon of $0.6billion related to early debt redemptions and $0.3billion related to the Wireless Transaction.
• Results of operations for the second quarter of 2014 include after-tax credits attributable to Verizon of $0.4billion related to a gain on spectrum license transactions.
• Results of operations for the fourth quarter of 2014 include after-tax charges attributable to Verizon of $4.7billion related to severance, pension and benefit charges, as well as after-tax
costs attributable to Verizon of $0.5billion related to early debt redemption and other costs.
(1) Net income (loss) attributable to Verizon per common share is computed independently for each quarter and the sum of the quarters may not equal the annual amount.
75Verizon Communications Inc. and Subsidiaries
Notes to Consolidated Financial Statements continued