America Online 2015 Annual Report Download - page 21
Download and view the complete annual report
Please find page 21 of the 2015 America Online annual report below. You can navigate through the pages in the report by either clicking on the pages listed below, or by using the keyword search tool below to find specific information within the annual report.-
 1
1 -
2
-
3
-
4
-
5
-
6
-
7
-
8
-
9
-
10
-
 11
11 -
 12
12 -
 13
13 -
 14
14 -
 15
15 -
 16
16 -
 17
17 -
 18
18 -
 19
19 -
 20
20 -
 21
21 -
 22
22 -
 23
23 -
 24
24 -
 25
25 -
 26
26 -
 27
27 -
 28
28 -
 29
29 -
 30
30 -
 31
31 -
32
-
33
-
34
-
35
-
36
-
37
-
38
-
39
-
40
-
41
-
42
-
43
-
44
-
45
-
46
-
47
-
48
-
49
-
50
-
51
-
52
-
53
-
54
-
55
-
56
-
57
-
58
-
59
-
60
-
61
-
62
-
63
-
64
-
65
-
66
-
67
-
68
-
69
-
70
-
71
-
72
-
73
-
74
-
75
-
76
-
77
-
78
-
79
-
80
 |
 |

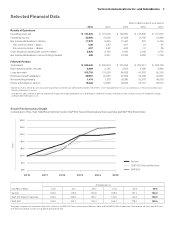
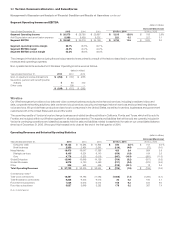
Segment Results of Operations
We have two reportable segments, Wireless and Wireline, which we operate and manage as strategic business units and organize by products
and services. We measure and evaluate our reportable segments based on segment operating income. The use of segment operating income is
consistent with the chief operating decision maker’s assessment of segment performance.
Segment earnings before interest, taxes, depreciation and amortization (Segment EBITDA), which is presented below, is a non-GAAP measure
and does not purport to be an alternative to operating income as a measure of operating performance. Management believes that this measure
is useful to investors and other users of our financial information in evaluating operating profitability on a more variable cost basis as it excludes
the depreciation and amortization expenses related primarily to capital expenditures and acquisitions that occurred in prior years, as well as in
evaluating operating performance in relation to our competitors. Segment EBITDA is calculated by adding back depreciation and amortization
expense to segment operating income.
Wireless Segment EBITDA margin is calculated by dividing Wireless Segment EBITDA by total Wireless revenues. Wireless Segment EBITDA
service margin, also presented below, is calculated by dividing Wireless Segment EBITDA by Wireless service revenues. Wireless Segment
EBITDA service margin utilizes service revenues rather than total revenues. Service revenues primarily exclude equipment revenues in order
to reflect the impact of providing service to the wireless customer base on an ongoing basis. Wireline Segment EBITDA margin is calculated by
dividing Wireline Segment EBITDA by total Wireline revenues. You can find additional information about our segments in Note13 to the consoli-
dated financial statements.
Wireless
Our Wireless segment, doing business as Verizon Wireless, provides wireless communications services across one of the most extensive
wireless networks in the United States. Verizon Wireless was formed as a joint venture in April 2000 by the combination of the U.S. wireless
operations and interests of Verizon and Vodafone. Prior to the completion of the Wireless Transaction, Verizon owned a controlling 55% interest in
Verizon Wireless and Vodafone owned the remaining 45%. On February21, 2014, the Wireless Transaction was completed and Verizon acquired
100% ownership of Verizon Wireless.
We provide these services and equipment sales to consumer, business and government customers in the United States on a postpaid and
prepaid basis. Postpaid connections represent individual lines of service for which a customer is billed in advance a monthly access charge in
return for a monthly network service allowance, and usage beyond the allowance is billed monthly in arrears. Our prepaid service enables individ-
uals to obtain wireless services without credit verification by paying for all services in advance.
All financial results included in the tables below reflect the consolidated results of Verizon Wireless.
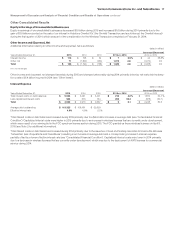
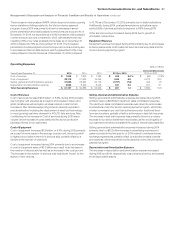
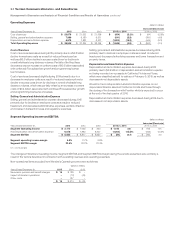
Operating Revenues and Selected Operating Statistics (dollars in millions, except ARPA)
Increase/(Decrease)
Years Ended December31, 2015 2014 2013 2015 vs. 2014 2014 vs. 2013
Service $ 70,396 $ 72,630 $ 69,033 $ (2,234) (3.1)% $ 3,597 5.2%
Equipment 16,924 10,959 8,111 5,965 54.4 2,848 35.1
Other 4,360 4,057 3,879 303 7.5 178 4.6
Total Operating Revenues $ 91,680 $ 87,646 $ 81,023 $ 4,034 4.6 $ 6,623 8.2
Connections (’000):(1)
Retail connections 112,108 108,211 102,799 3,897 3.6 5,412 5.3
Retail postpaid connections 106,528 102,079 96,752 4,449 4.4 5,327 5.5
Net additions in period (’000):(2)
Retail connections 3,956 5,568 4,472 (1,612) (29.0) 1,096 24.5
Retail postpaid connections 4,507 5,482 4,118 (975) (17.8) 1,364 33.1
Churn Rate:
Retail connections 1.24% 1.33% 1.27%
Retail postpaid connections 0.96% 1.04% 0.97%
Account Statistics:
Retail postpaid ARPA $ 152.63 $ 159.86 $ 153.93 $ (7.23) (4.5) $ 5.93 3.9
Retail postpaid accounts (’000)(1) 35,736 35,616 35,083 120 0.3 533 1.5
Retail postpaid connections per account(1) 2.98 2.87 2.76 0.11 3.8 0.11 4.0
(1) As of end of period
(2) Excluding acquisitions and adjustments
19Verizon Communications Inc. and Subsidiaries
Management’s Discussion and Analysis ofFinancialCondition and Results of Operations continued