America Online 2015 Annual Report Download - page 69
Download and view the complete annual report
Please find page 69 of the 2015 America Online annual report below. You can navigate through the pages in the report by either clicking on the pages listed below, or by using the keyword search tool below to find specific information within the annual report.-
 1
1 -
2
-
3
-
4
-
5
-
6
-
7
-
8
-
9
-
10
-
11
-
12
-
13
-
14
-
15
-
16
-
17
-
18
-
19
-
20
-
21
-
22
-
23
-
24
-
25
-
26
-
27
-
28
-
29
-
30
-
31
-
32
-
33
-
34
-
35
-
36
-
37
-
38
-
39
-
40
-
41
-
42
-
43
-
44
-
45
-
46
-
47
-
48
-
49
-
50
-
51
-
52
-
53
-
54
-
55
-
56
-
57
-
58
-
 59
59 -
 60
60 -
 61
61 -
 62
62 -
 63
63 -
 64
64 -
 65
65 -
 66
66 -
 67
67 -
 68
68 -
 69
69 -
 70
70 -
 71
71 -
 72
72 -
 73
73 -
 74
74 -
 75
75 -
 76
76 -
 77
77 -
 78
78 -
 79
79 -
80
 |
 |

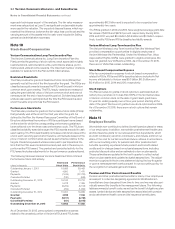
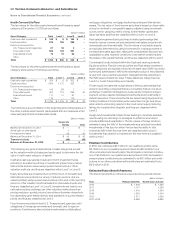
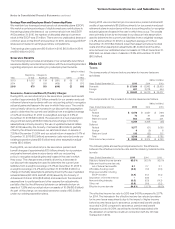
In order to project the long-term target investment return for the total
portfolio, estimates are prepared for the total return of each major
asset class over the subsequent 10-year period. Those estimates are
based on a combination of factors including the current market interest
rates and valuation levels, consensus earnings expectations and his-
torical long-term risk premiums. To determine the aggregate return for
the pension trust, the projected return of each individual asset class is
then weighted according to the allocation to that investment area in the
trust’s long-term asset allocation policy.
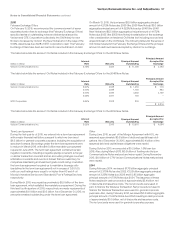
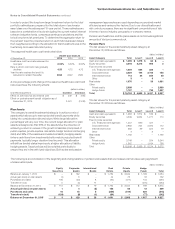
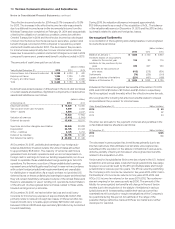
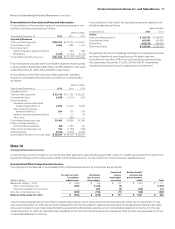
The assumed health care cost trend rates follow:
Health Care and Life
At December31, 2015 2014 2013
Healthcare cost trend rate assumed for
next year 6.00% 6.50% 6.50%
Rate to which cost trend rate gradually
declines 4.50 4.75 4.75
Year the rate reaches the level it is
assumed to remain thereafter 2024 2022 2020
A one- percentage point change in the assumed health care cost trend
rate would have the following effects:
(dollars in millions)
One- Percentage Point Increase Decrease
Effect on 2015 service and interest cost $ 249 $ (194)
Effect on postretirement benet obligation as of
December31, 2015 3,074 (2,516)
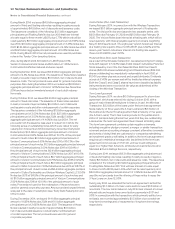
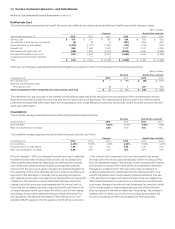
Plan Assets
The company’s overall investment strategy is to achieve a mix of
assets which allows us to meet projected benefit payments while
taking into consideration risk and return. While target allocation
percentages will vary over time, the current target allocation for plan
assets is designed so that 65% of the assets have the objective of
achieving a return in excess of the growth in liabilities (comprised of
public equities, private equities, real estate, hedge funds and emerging
debt) and 35% of the assets are invested as liability hedging assets
(where cash flows from investments better match projected benefit
payments, typically longer duration fixed income). This allocation
will shift as funded status improves to a higher allocation of liability
hedging assets. Target policies will be revisited periodically to
ensure they are in line with fund objectives. Both active and passive
management approaches are used depending on perceived market
efficiencies and various other factors. Due to our diversification and
risk control processes, there are no significant concentrations of risk,
in terms of sector, industry, geography or company names.
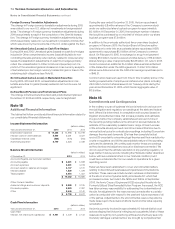
Pension and healthcare and life plans assets do not include significant
amounts of Verizon common stock.
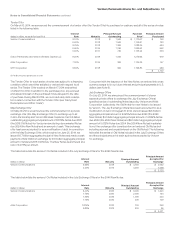
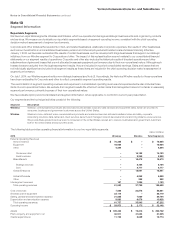
Pension Plans
The fair values for the pension plans by asset category at
December31, 2015 are as follows:
(dollars in millions)
Asset Category Total Level 1 Level 2 Level 3
Cash and cash equivalents $ 1,459 $ 1,375 $ 84 $ –
Equity securities 3,216 2,313 900 3
Fixed income securities
U.S. Treasuries and agencies 1,264 884 380 –
Corporate bonds 3,024 194 2,702 128
International bonds 713 34 659 20
Other 3 – 3 –
Real estate 1,670 – 39 1,631
Other
Private equity 2,988 – – 2,988
Hedge funds 1,787 – 730 1,057
Total $ 16,124 $ 4,800 $ 5,497 $ 5,827
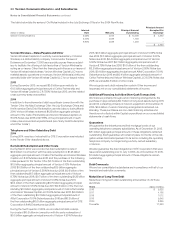
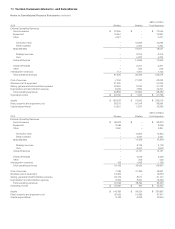
The fair values for the pension plans by asset category at
December31, 2014 are as follows:
(dollars in millions)
Asset Category Total Level 1 Level 2 Level 3
Cash and cash equivalents $ 1,983 $ 1,814 $ 169 $ –
Equity securities 4,339 2,952 1,277 110
Fixed income securities
U.S. Treasuries and agencies 1,257 830 427 –
Corporate bonds 2,882 264 2,506 112
International bonds 582 39 524 19
Other 3 – 3 –
Real estate 1,792 – – 1,792
Other
Private equity 3,748 – 204 3,544
Hedge funds 1,962 – 1,164 798
Total $ 18,548 $ 5,899 $ 6,274 $ 6,375
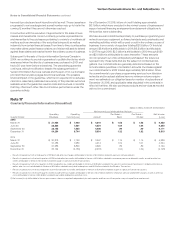
The following is a reconciliation of the beginning and ending balance of pension plan assets that are measured at fair value using significant
unobservable inputs:
(dollars in millions)
Equity
Securities
Corporate
Bonds
International
Bonds
Real
Estate
Private
Equity
Hedge
Funds Total
Balance at January1, 2014 $ – $ 162 $ – $ 1,784 $ 3,942 $ 1,196 $ 7,084
Actual gain (loss) on plan assets (1) 5 – 42 73 33 152
Purchases and sales 106 (50) 8 (34) (471) 144 (297)
Transfers in (out) 5 (5) 11 – – (575) (564)
Balance at December31, 2014 $ 110 $ 112 $ 19 $ 1,792 $ 3,544 $ 798 $ 6,375
Actual gain (loss) on plan assets 1 4 (3) 132 63 12 209
Purchases and sales 16 18 5 (259) (619) 324 (515)
Transfers in (out) (124) (6) (1) (34) – (77) (242)
Balance at December31, 2015 $ 3 $ 128 $ 20 $ 1,631 $ 2,988 $ 1,057 $ 5,827
67Verizon Communications Inc. and Subsidiaries
Notes to Consolidated Financial Statements continued