America Online 2015 Annual Report Download - page 25
Download and view the complete annual report
Please find page 25 of the 2015 America Online annual report below. You can navigate through the pages in the report by either clicking on the pages listed below, or by using the keyword search tool below to find specific information within the annual report.-
 1
1 -
2
-
3
-
4
-
5
-
6
-
7
-
8
-
9
-
10
-
11
-
12
-
13
-
14
-
 15
15 -
 16
16 -
 17
17 -
 18
18 -
 19
19 -
 20
20 -
 21
21 -
 22
22 -
 23
23 -
 24
24 -
 25
25 -
 26
26 -
 27
27 -
 28
28 -
 29
29 -
 30
30 -
 31
31 -
 32
32 -
 33
33 -
 34
34 -
 35
35 -
36
-
37
-
38
-
39
-
40
-
41
-
42
-
43
-
44
-
45
-
46
-
47
-
48
-
49
-
50
-
51
-
52
-
53
-
54
-
55
-
56
-
57
-
58
-
59
-
60
-
61
-
62
-
63
-
64
-
65
-
66
-
67
-
68
-
69
-
70
-
71
-
72
-
73
-
74
-
75
-
76
-
77
-
78
-
79
-
80
 |
 |
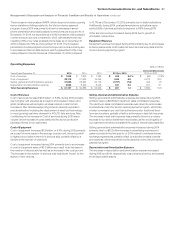
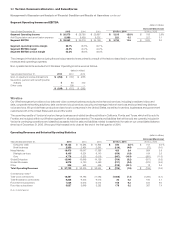
Wireline’s revenues decreased $0.7billion, or 1.8%, during 2015
primarily driven by declines in Global Enterprise, partially offset by
higher Mass Markets revenues driven by Fios services. Fios revenues
increased $1.1billion, or 8.6%, during 2015.
Mass Markets
Mass Markets operations provide broadband Internet and video
services (including high-speed Internet, Fios Internet and Fios video
services), local exchange (basic service and end-user access) and
long distance (including regional toll) voice services to residential and
small business subscribers.
2015 Compared to 2014
Mass Markets revenues increased $0.4billion, or 2.4%, during 2015
primarily due to the expansion of Fios services (voice, Internet and
video), including our Fios Quantum offerings, as well as changes in
our pricing strategies, partially offset by the continued decline of local
exchange revenues.
During 2015, we grew our subscriber base by 0.4million Fios Internet
subscribers and by 0.2million Fios video subscribers, while also
improving the penetration rate within our Fios service areas for Fios
Internet. As of December31, 2015, we achieved a penetration rate of
41.8% for Fios Internet compared to a penetration rate of 41.1% for Fios
Internet as of December31, 2014. During 2015, Consumer Fios revenue
increased $1.0billion, or 8.3%. Fios represented approximately 79% of
Consumer retail revenue during 2015 compared to approximately 76%
during 2014.
The decline of local exchange revenues was primarily due to a 6.9%
decline in Consumer retail voice connections resulting primarily from
competition and technology substitution with wireless, competing
VoIP and cable telephony services. Total voice connections include
traditional switched access lines in service as well as Fios digital voice
connections. There was also a 7.1% decline in Small business retail
voice connections, reflecting competition and a shift to both IP and
high-speed circuits, primarily in areas outside of our Fios footprint.
2014 Compared to 2013
Mass Markets revenues increased $0.7billion, or 3.8%, during 2014
primarily due to the expansion of Fios services (voice, Internet and
video), including our Fios Quantum offerings, as well as changes
in our pricing strategies, partially offset by the continued decline of
local exchange revenues. Fios represented approximately 76% of
Consumer retail revenue during 2014 compared to approximately 71%
during 2013.
During 2014, we grew our subscriber base by 0.5million Fios Internet
subscribers and by 0.4million Fios video subscribers, while also
improving penetration rates within our Fios service areas. As of
December31, 2014, we achieved penetration rates of 41.1% and 35.8%
for Fios Internet and Fios video, respectively, compared to penetration
rates of 39.5% and 35.0% for Fios Internet and Fios video, respectively,
at December31, 2013.
The increase in Mass Markets revenues was partially offset by the
decline of local exchange revenues primarily due to a 5.5% decline
in Consumer retail voice connections resulting primarily from com-
petition and technology substitution with wireless, competing VoIP
and cable telephony services. Total voice connections include tra-
ditional switched access lines in service as well as Fios digital voice
connections. There was also a decline in Small business retail voice
connections, primarily reflecting competition and a shift to both IP and
high-speed circuits.
Global Enterprise
Global Enterprise offers strategic services and other core communica-
tions services to medium and large business customers, multinational
corporations and state and federal government customers.
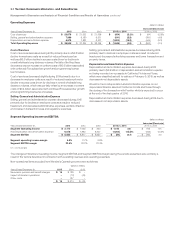
2015 Compared to 2014
Global Enterprise revenues decreased $0.7billion, or 5.2%, during
2015 primarily due to a $0.4billion, or 11.7%, decline in core voice
services and data networking revenues, which consist of traditional
circuit-based services such as frame relay, private line and legacy
voice and data services. These core services declined as a result of
secular declines. Also contributing to the decrease were lower net-
working solutions revenues, a decline in customer premise equipment
revenues and the negative impact of foreign exchange rates.
Networking solutions, which include Private IP, Public Internet, Ethernet
and optical network services, declined $0.2billion, or 4.6%, as a result
of competitive price compression.
2014 Compared to 2013
Global Enterprise revenues decreased $0.5billion, or 3.6%, during
2014 primarily due to a decline in voice services and data networking
revenues, which consist of traditional circuit-based services such as
frame relay, private line and legacy voice and data services. These
core services declined as customers continued to migrate to next
generation IP services. Also contributing to the decrease was the
contraction of market rates due to competition and a decline in Core
customer premise equipment revenues. This decrease was partially
offset by an increase in strategic services revenues of $0.2billion, or
2.3%, primarily due to growth in our application services, such as our
cloud and data center offerings and contract center solutions.
Global Wholesale
Global Wholesale provides communications services including data,
voice and local dial tone and broadband services primarily to local,
long distance and other carriers that use our facilities to provide
services to their customers.
2015 Compared to 2014
Global Wholesale revenues decreased $0.2billion, or 3.4%, during
2015 primarily due to declines in traditional voice revenues and data
revenues driven by the effect of technology substitution as well as
continuing contraction of market rates due to competition. The decline
in traditional voice revenue was primarily due to a decrease in minutes
of use (MOUs) driven by a 6.5% decline in domestic wholesale con-
nections between December31, 2015 and December31, 2014. As
a result of technology substitution, the number of core data circuits
at December31, 2015 experienced a 14.5% decline compared to
December31, 2014.
2014 Compared to 2013
Global Wholesale revenues decreased $0.4billion, or 5.6%, during
2014 primarily due to a decline in data and traditional voice revenues.
Data revenue declines were driven by the continuing demand for high-
speed digital data services from fiber-to-the-cell customers upgrading
their core data circuits to Ethernet facilities. As a result of the customer
migrations, at December31, 2014, the number of core data circuits
experienced a 14.2% decline. The traditional voice revenue declines
are primarily due to a decrease in MOUs and the effect of technology
substitution. As of December31, 2014, we also experienced a 6.2%
decline in domestic wholesale connections. Also contributing to the
decline in voice revenues is the continuing contraction of market rates
due to competition.
23Verizon Communications Inc. and Subsidiaries
Management’s Discussion and Analysis ofFinancialCondition and Results of Operations continued