America Online 2015 Annual Report Download - page 71
Download and view the complete annual report
Please find page 71 of the 2015 America Online annual report below. You can navigate through the pages in the report by either clicking on the pages listed below, or by using the keyword search tool below to find specific information within the annual report.-
 1
1 -
2
-
3
-
4
-
5
-
6
-
7
-
8
-
9
-
10
-
11
-
12
-
13
-
14
-
15
-
16
-
17
-
18
-
19
-
20
-
21
-
22
-
23
-
24
-
25
-
26
-
27
-
28
-
29
-
30
-
31
-
32
-
33
-
34
-
35
-
36
-
37
-
38
-
39
-
40
-
41
-
42
-
43
-
44
-
45
-
46
-
47
-
48
-
49
-
50
-
51
-
52
-
53
-
54
-
55
-
56
-
57
-
58
-
59
-
60
-
 61
61 -
 62
62 -
 63
63 -
 64
64 -
 65
65 -
 66
66 -
 67
67 -
 68
68 -
 69
69 -
 70
70 -
 71
71 -
 72
72 -
 73
73 -
 74
74 -
 75
75 -
 76
76 -
 77
77 -
 78
78 -
 79
79 -
 80
80
 |
 |

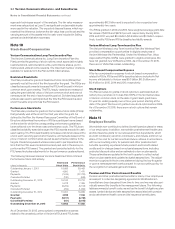
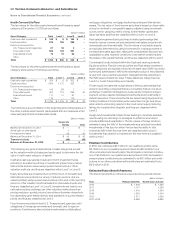
Savings Plan and Employee Stock Ownership Plans
We maintain four leveraged employee stock ownership plans (ESOP).
We match a certain percentage of eligible employee contributions to
the savings plans with shares of our common stock from this ESOP.
At December31, 2015, the number of allocated shares of common
stock in this ESOP was 57million. There were no unallocated shares of
common stock in this ESOP at December31, 2015. All leveraged ESOP
shares are included in earnings per share computations.
Total savings plan costs were $0.9billion in 2015, $0.9billion in 2014
and $1.0billion in 2013.
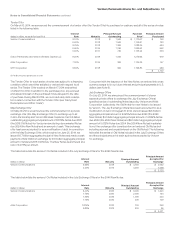
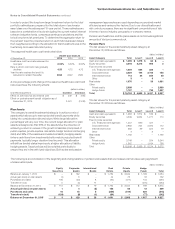
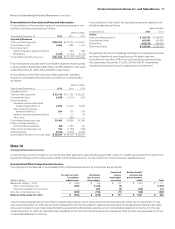
Severance Benefits
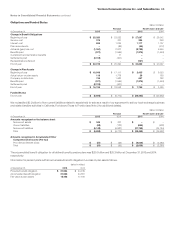
The following table provides an analysis of our actuarially determined
severance liability recorded in accordance with the accounting standard
regarding employers’ accounting for postemployment benefits:
(dollars in millions)
Year
Beginning
of Year
Charged to
Expense Payments Other
End
of Year
2013 $ 1,010 $ 134 $ (381) $ (6) $ 757
2014 757 531 (406) (7) 875
2015 875 551 (619) (7) 800
Severance, Pension and Benefit (Credits) Charges
During 2015, we recorded net pre-tax severance, pension and benefit
credits of approximately $2.3billion primarily for our pension and post-
retirement plans in accordance with our accounting policy to recognize
actuarial gains and losses in the year in which they occur. The credits
were primarily driven by an increase in our discount rate assumption
used to determine the current year liabilities from a weighted- average
of 4.2% at December31, 2014 to a weighted- average of 4.6% at
December31, 2015 ($2.5billion), the execution of a new prescription
drug contract during 2015 ($1.0billion) and a change in mortality
assumptions primarily driven by the use of updated actuarial tables
(MP-2015) issued by the Society of Actuaries ($0.9billion), partially
offset by the difference between our estimated return on assets of
7.25% at December31, 2014 and our actual return on assets of 0.7% at
December31, 2015 ($1.2billion), severance costs recorded under our
existing separation plans ($0.6billion) and other assumption adjust-
ments ($0.3billion).
During 2014, we recorded net pre-tax severance, pension and
benefit charges of approximately $7.5billion primarily for our pension
and postretirement plans in accordance with our accounting
policy to recognize actuarial gains and losses in the year in which
they occur. The charges were primarily driven by a decrease in
our discount rate assumption used to determine the current year
liabilities from a weighted- average of 5.0% at December31, 2013 to
a weighted- average of 4.2% at December31, 2014 ($5.2billion), a
change in mortality assumptions primarily driven by the use of updated
actuarial tables (RP-2014 and MP-2014) issued by the Society of
Actuaries in October 2014 ($1.8billion) and revisions to the retirement
assumptions for participants and other assumption adjustments,
partially offset by the difference between our estimated return on
assets of 7.25% and our actual return on assets of 10.5% ($0.6billion).
As part of this charge, we recorded severance costs of $0.5billion
under our existing separation plans.
During 2013, we recorded net pre-tax severance, pension and benefit
credits of approximately $6.2billion primarily for our pension and post-
retirement plans in accordance with our accounting policy to recognize
actuarial gains and losses in the year in which they occur. The credits
were primarily driven by an increase in our discount rate assumption
used to determine the current year liabilities from a weighted- average
of 4.2% at December31, 2012 to a weighted- average of 5.0% at
December31, 2013 ($4.3billion), lower than assumed retiree medical
costs and other assumption adjustments ($1.4billion) and the differ-
ence between our estimated return on assets of 7.5% at December31,
2012 and our actual return on assets of 8.6% at December31, 2013
($0.5billion).
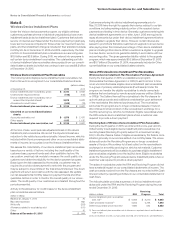
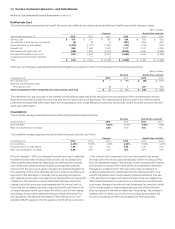
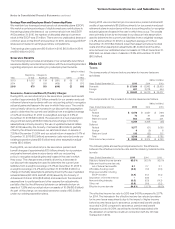
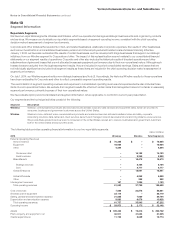
Note12
Taxes
The components of income before provision for income taxes are
as follows:
(dollars in millions)
Years Ended December31, 2015 2014 2013
Domestic $ 27,639 $ 12,992 $ 28,833
Foreign 601 2,278 444
Total $ 28,240 $ 15,270 $ 29,277
The components of the provision for income taxes are as follows:
(dollars in millions)
Years Ended December31, 2015 2014 2013
Current
Federal $ 5,476 $ 2,657 $ (197)
Foreign 70 81 (59)
State and Local 803 668 201
Total 6,349 3,406 (55)
Deferred
Federal 3,377 (51) 5,060
Foreign 9 (9) 8
State and Local 130 (32) 717
Total 3,516 (92) 5,785
Total income tax provision $ 9,865 $ 3,314 $ 5,730
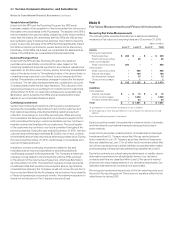
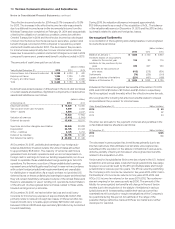
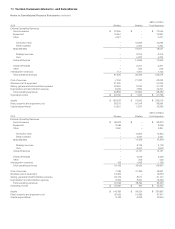
The following table shows the principal reasons for the difference
between the effective income tax rate and the statutory federal income
tax rate:
Years Ended December31, 2015 2014 2013
Statutory federal income tax rate 35.0 % 35.0 % 35.0 %
State and local income tax rate,
net of federal tax benets 2.1 2.7 2.1
Affordable housing credit (0.5) (1.0) (0.6)
Employee benets including
ESOP dividend (0.4) (0.7) (0.4)
Disposition of Omnitel Interest – (5.9) –
Noncontrolling interests (0.5) (5.0) (14.3)
Other, net (0.8) (3.4) (2.2)
Effective income tax rate 34.9 % 21.7 % 19.6 %
The effective income tax rate for 2015 was 34.9% compared to 21.7%
for 2014. The increase in the effective income tax rate and provision
forincome taxes was primarily due to the impact of higher income
before income taxes due to severance, pension and benefit credits
recorded in 2015 compared to severance, pension and benefit
chargesrecorded in 2014, as well as tax benefits associated with
the utilization of certain tax credits in connection with the Omnitel
Transaction in 2014.
69Verizon Communications Inc. and Subsidiaries
Notes to Consolidated Financial Statements continued