America Online 2015 Annual Report Download - page 31
Download and view the complete annual report
Please find page 31 of the 2015 America Online annual report below. You can navigate through the pages in the report by either clicking on the pages listed below, or by using the keyword search tool below to find specific information within the annual report.-
 1
1 -
2
-
3
-
4
-
5
-
6
-
7
-
8
-
9
-
10
-
11
-
12
-
13
-
14
-
15
-
16
-
17
-
18
-
19
-
20
-
 21
21 -
 22
22 -
 23
23 -
 24
24 -
 25
25 -
 26
26 -
 27
27 -
 28
28 -
 29
29 -
 30
30 -
 31
31 -
 32
32 -
 33
33 -
 34
34 -
 35
35 -
 36
36 -
 37
37 -
 38
38 -
 39
39 -
 40
40 -
 41
41 -
42
-
43
-
44
-
45
-
46
-
47
-
48
-
49
-
50
-
51
-
52
-
53
-
54
-
55
-
56
-
57
-
58
-
59
-
60
-
61
-
62
-
63
-
64
-
65
-
66
-
67
-
68
-
69
-
70
-
71
-
72
-
73
-
74
-
75
-
76
-
77
-
78
-
79
-
80
 |
 |

Other, net
The change in Other, net financing activities during 2013 was primarily
driven by higher distributions to Vodafone, which owned a 45% non-
controlling interest in Verizon Wireless as of December31, 2013.
Credit Facility
As of December31, 2015, the unused borrowing capacity under our
$8.0billion four-year credit facility was approximately $7.9billion. The
credit facility does not require us to comply with financial covenants
or maintain specified credit ratings, and it permits us to borrow even
if our business has incurred a material adverse change. We use the
credit facility for the issuance of letters of credit and for general
corporate purposes.
Common Stock
Common stock has been used from time to time to satisfy some
of the funding requirements of employee and shareholder plans,
including 22.6million, 18.2million and 6.9million common shares
issued from Treasury stock during 2015, 2014 and 2013, respectively,
which had aggregate values of $0.9billion, $0.7billion and $0.3billion,
respectively.
In February 2015, the Verizon Board of Directors authorized Verizon to
enter into an accelerated share repurchase (ASR) agreement to repur-
chase $5.0billion of the Company’s common stock. On February10,
2015, in exchange for an upfront payment totaling $5.0billion, Verizon
received an initial delivery of 86.2million shares having a value of
approximately $4.25billion. On June5, 2015, Verizon received an addi-
tional 15.4million shares as final settlement of the transaction under
the ASR agreement. In total, 101.6million shares were delivered under
the ASR at an average repurchase price of $49.21.
On March7, 2014, the Verizon Board of Directors approved a share
buyback program, which authorizes the repurchase of up to 100million
shares of Verizon common stock terminating no later than the close of
business on February28, 2017. The program permits Verizon to repur-
chase shares over time, with the amount and timing of repurchases
depending on market conditions and corporate needs. The Board also
determined that no additional shares were to be purchased under the
prior program. During 2015, we repurchased $0.1billion of our common
stock as part of our previously announced share buyback program.
There were no repurchases of common stock during 2014. During
2013, we repurchased $0.2billion of our common stock under our
previous share buyback program.
As a result of the Wireless Transaction, in February 2014, Verizon
issued approximately 1.27billion shares.
Credit Ratings
Verizon’s credit ratings did not change in 2015 or 2014.
During the third quarter of 2013, Verizon’s credit ratings were down-
graded by Moody’s Investors Service (Moody’s), Standard & Poor’s
Ratings Services (Standard & Poor’s) and Fitch Ratings (Fitch) as
a result of Verizon’s announcement of the agreement to acquire
Vodafone’s 45% noncontrolling interest in Verizon Wireless for
approximately $130billion including the incurrence of third-party
indebtedness to fund the cash portion of the purchase price for the
Wireless Transaction. Moody’s downgraded Verizon’s long-term debt
ratings one notch from A3 to Baa1, while Standard & Poor’s lowered
its corporate credit rating and senior unsecured debt rating one notch
from A- to BBB+ and Fitch lowered its long-term issuer default rating
and senior unsecured debt rating one notch from A to A-.
Securities ratings assigned by rating organizations are expressions of
opinion and are not recommendations to buy, sell or hold securities. A
securities rating is subject to revision or withdrawal at any time by the
assigning rating organization. Each rating should be evaluated inde-
pendently of any other rating.
Covenants
Our credit agreements contain covenants that are typical for large,
investment grade companies. These covenants include requirements
to pay interest and principal in a timely fashion, pay taxes, maintain
insurance with responsible and reputable insurance companies,
preserve our corporate existence, keep appropriate books and
records of financial transactions, maintain our properties, provide
financial and other reports to our lenders, limit pledging and dispo-
sition of assets and mergers and consolidations, and other similar
covenants. Additionally, our term loan credit agreement requires us to
maintain a leverage ratio (as such term is defined in those agreements)
not in excess of 3.50:1.00 until our credit ratings are equal to or higher
than A3 and A-. See Note7 to the consolidated financial statements for
additional details related to our term loan credit agreement.
We and our consolidated subsidiaries are in compliance with all of our
financial and restrictive covenants.
Increase (Decrease) In Cash and Cash Equivalents
Our Cash and cash equivalents at December31, 2015 totaled
$4.5billion, a $6.1billion decrease compared to Cash and cash
equivalents at December31, 2014 primarily as a result of the factors
discussed above. Our Cash and cash equivalents at December31,
2014 totaled $10.6billion, a $42.9billion decrease compared to Cash
and cash equivalents at December31, 2013 primarily as a result of
the cash payment made to Vodafone as part of the completion of the
Wireless Transaction.
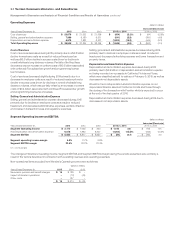
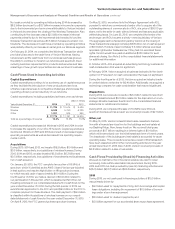
Free Cash Flow
Free cash flow is a non-GAAP financial measure that management
believes is useful to investors and other users of Verizon’s financial
information in evaluating cash available to pay debt and dividends.
Free cash flow is calculated by subtracting capital expenditures from
net cash provided by operating activities. The following table recon-
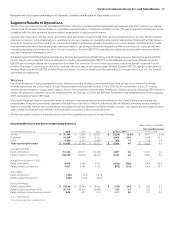
ciles net cash provided by operating activities to Free cash flow:
(dollars in millions)
Years Ended December31, 2015 2014 2013
Net cash provided by operating
activities $ 38,930 $ 30,631 $ 38,818
Less Capital expenditures
(including capitalized software) 17,775 17,191 16,604
Free cash ow $ 21,155 $ 13,440 $ 22,214
The changes in free cash flow during 2015, 2014 and 2013 were a
result of the factors described in connection with net cash provided by
operating activities and capital expenditures. During 2015, we received
$5.9billion of cash proceeds, net of remittances, related to the sale of
wireless device installment receivables as well as $2.4billion of cash
proceeds received related to the Tower Monetization Transaction
attributable to the portion of the towers for which the right-of-use has
passed to the tower operator. On February21, 2014, we completed the
Wireless Transaction which provides full access to the cash flows of
Verizon Wireless. The completion of the Wireless Transaction resulted
in an increase in income tax payments as well as an increase in interest
payments, which reduced our net cash provided by operating activities
during 2014 (see “Cash Flows Provided by Operating Activities”).
29Verizon Communications Inc. and Subsidiaries
Management’s Discussion and Analysis ofFinancialCondition and Results of Operations continued