America Online 2015 Annual Report Download - page 23
Download and view the complete annual report
Please find page 23 of the 2015 America Online annual report below. You can navigate through the pages in the report by either clicking on the pages listed below, or by using the keyword search tool below to find specific information within the annual report.-
 1
1 -
2
-
3
-
4
-
5
-
6
-
7
-
8
-
9
-
10
-
11
-
12
-
 13
13 -
 14
14 -
 15
15 -
 16
16 -
 17
17 -
 18
18 -
 19
19 -
 20
20 -
 21
21 -
 22
22 -
 23
23 -
 24
24 -
 25
25 -
 26
26 -
 27
27 -
 28
28 -
 29
29 -
 30
30 -
 31
31 -
 32
32 -
 33
33 -
34
-
35
-
36
-
37
-
38
-
39
-
40
-
41
-
42
-
43
-
44
-
45
-
46
-
47
-
48
-
49
-
50
-
51
-
52
-
53
-
54
-
55
-
56
-
57
-
58
-
59
-
60
-
61
-
62
-
63
-
64
-
65
-
66
-
67
-
68
-
69
-
70
-
71
-
72
-
73
-
74
-
75
-
76
-
77
-
78
-
79
-
80
 |
 |

The increase in retail postpaid ARPA, which does not include recurring
device installment billings related to the Verizon device payment
program, during 2014 was primarily driven by increases in smart-
phone penetration and retail postpaid connections per account. As of
December31, 2014, we experienced a 4.0% increase in retail postpaid
connections per account compared to 2013, with smartphones rep-
resenting 79% of our retail postpaid phone base as of December31,
2014 compared to 70% as of December31, 2013. The increased
penetration in retail postpaid connections per account is primarily due
to increases in Internet data devices, which represented 14.1% of our
retail postpaid connection base as of December31, 2014 compared
to 10.7% as of December31, 2013, primarily due to tablet activations.
Additionally, during 2014, postpaid smartphone activations repre-
sented 92% of phones activated compared to 86% during 2013.
Other service revenue increased during 2014 due to growth in
wholesale connections.
Equipment Revenue
Equipment revenue increased during 2014 primarily due to an increase
in device sales under both traditional fixed-term service plans and the
Verizon device payment program.
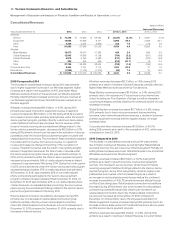
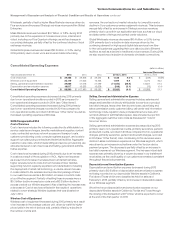
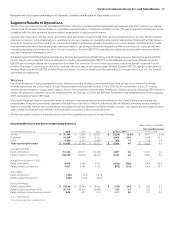
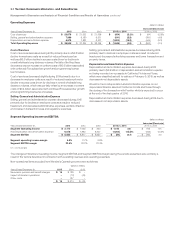
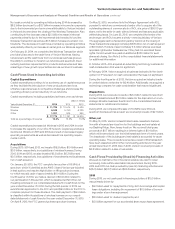
Operating Expenses
(dollars in millions)
Increase/(Decrease)
Years Ended December31, 2015 2014 2013 2015 vs. 2014 2014 vs. 2013
Cost of services $ 7,803 $ 7,200 $ 7,295 $ 603 8.4 % $ (95) (1.3)%
Cost of equipment 23,119 21,625 16,353 1,494 6.9 5,272 32.2
Selling, general and administrative expense 21,805 23,602 23,176 (1,797) (7.6) 426 1.8
Depreciation and amortization expense 8,980 8,459 8,202 521 6.2 257 3.1
Total Operating Expenses $ 61,707 $ 60,886 $ 55,026 $ 821 1.3 $ 5,860 10.6
Cost of Services
Cost of services increased $0.6billion, or 8.4%, during 2015 primarily
due to higher rent expense as a result of an increase in macro and
small cell sites as well as higher wireless network costs from an
increase in fiber facilities supporting network capacity expansion
and densification, including the deployment of small cell technology,
to meet growing customer demand for 4G LTE data services. Also
contributing to the increase in Cost of services during 2015 was a
volume- driven increase in costs related to the device protection
package offered to our customers.
Cost of Equipment
Cost of equipment increased $1.5billion, or 6.9%, during 2015 primarily
as a result of an increase in the average cost per unit, driven by a shift
to higher priced units in the mix of devices sold, partially offset by a
decline in the number of units sold.
Cost of equipment increased during 2014 primarily due to an increase
in cost of equipment sales of $5.3billion as a result of an increase in
the number of devices sold as well as an increase in the cost per unit.
The increase in the number of devices sold was driven, in part, by the
launch of new devices.
Selling, General and Administrative Expense
Selling, general and administrative expense decreased during 2015
primarily due to a $2.8billion decline in sales commission expense.
The decline in sales commission expense was driven by an increase
in activations under the Verizon device payment program, which has
a lower commission per unit than activations under traditional fixed-
term service plans, partially offset by an increase in bad debt expense.
The increase in bad debt expense was primarily driven by a volume
increase in our device installment receivables, as the credit quality of
our customers remained consistent throughout the periods presented.
Selling, general and administrative expense increased during 2014
primarily due to a $0.2billion increase in advertising expense and
gains recorded in the first quarter of 2013 related to wireless license
exchange agreements, partially offset by a decline in sales commis-
sion expense, which was driven by the adoption of the Verizon device
payment program.
Depreciation and Amortization Expense
The increase in depreciation and amortization expense increased
during 2015 and 2014, respectively, was primarily driven by an increase
in net depreciable assets.
21Verizon Communications Inc. and Subsidiaries
Management’s Discussion and Analysis ofFinancialCondition and Results of Operations continued