Cabela's 2007 Annual Report Download - page 3
Download and view the complete annual report
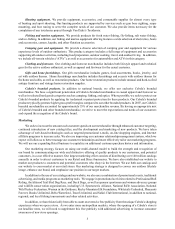
Please find page 3 of the 2007 Cabela's annual report below. You can navigate through the pages in the report by either clicking on the pages listed below, or by using the keyword search tool below to find specific information within the annual report.-
 1
1 -
 2
2 -
 3
3 -
 4
4 -
 5
5 -
 6
6 -
 7
7 -
 8
8 -
 9
9 -
 10
10 -
 11
11 -
 12
12 -
 13
13 -
 14
14 -
15
-
16
-
17
-
18
-
19
-
20
-
21
-
22
-
23
-
24
-
25
-
26
-
27
-
28
-
29
-
30
-
31
-
32
-
33
-
34
-
35
-
36
-
37
-
38
-
39
-
40
-
41
-
42
-
43
-
44
-
45
-
46
-
47
-
48
-
49
-
50
-
51
-
52
-
53
-
54
-
55
-
56
-
57
-
58
-
59
-
60
-
61
-
62
-
63
-
64
-
65
-
66
-
67
-
68
-
69
-
70
-
71
-
72
-
73
-
74
-
75
-
76
-
77
-
78
-
79
-
80
-
81
-
82
-
83
-
84
-
85
-
86
-
87
-
88
-
89
-
90
-
91
-
92
-
93
-
94
-
95
-
96
-
97
-
98
-
99
-
100
-
101
-
102
-
103
-
104
-
105
-
106
 |
 |

Letter To Shareholders
Dear Cabela’s Shareholders:
Refl ecting back on 2007, I have spent
considerable time understanding where we
successfully executed and where we did not
execute in our business. On one hand,
we accomplished signifi cant goals, such as
opening eight new retail stores on or ahead
of schedule, including seven in a two-month
period. On the other hand, we had several
challenges, most signifi cantly a tough retail
environment in the back half of 2007. We
also experienced challenges in our fast-
growing retail business, revolving around the
execution of our retail model. Adapting our
business from a world-class direct marketing
company to a fl uid retail business requires
signifi cant changes to our core-operating
model. Transition to retail is a big change
for our company, and I will talk more about
this later.
Not to be overshadowed by operating
results, our company celebrated signifi cant
accomplishments in 2007 by delivering
record revenue and record diluted earnings per
share. In addition, we added customer service
enhancements in several retail stores, which
allow customers to shop seamlessly across
all channels. Through our In-Store Pick Up
Program, customers now have the ability
to order products from our direct business
and pick them up at one of our stores. In
addition, our new In-Store Kiosk Program
allows retail customers to order from our
entire product inventory, the largest product
assortment in the outdoor industry. Also, our
highly successful Web site, www.cabelas.com,
was once again the most visited e-commerce
Web site in the sporting goods industry for
2007, according to Hitwise Incorporated.
And, in accordance with our plan to further
expand our brand, we acquired S.I.R.
Warehouse Sports Store in Winnipeg,
Manitoba, Canada, which constitutes our
fi rst retail presence in the Canadian market
and will serve as headquarters for future
Canadian expansion. Not only are we very
excited about our entrance into the Canadian
market, but our customers have shared their
excitement with us as well. I look forward
to leveraging our strong brand recognition in
Canada and providing a new level of brand
experience to Canadian consumers.
Our 2007 achievements provide a strong
foundation for future growth, and I am very
proud of the dedicated employees who made
it happen.
Fiscal 2007 Financial Results
For fi scal 2007, we earned a record $88
million, or $1.31 per diluted share, as
compared to $86 million, or $1.29 per
diluted share, in fi scal 2006. Total revenue
for 2007 increased 13.9% to $2.35 billion.
Revenue from our direct business (catalog
and Internet) increased a solid 3.9% to
$1.13 billion. Despite a 1.2% decline in same
store sales, retail revenue increased 27.2% to
$1.04 billion due to a full-year contribution
of four stores opened in 2006 and sales from
eight new stores opened in 2007. Financial
services revenue increased 15.9% to $159
million. We now have more than one million
active credit card account holders who earn
rewards redeemable across our multi-channel
model. In 2007, purchases made by these
cardholders represented more than 26% of
our sales.
The Year Ahead
Given the challenging macro-economic
environment we experienced in the second
half of 2007 and expect to continue into
2008, we made the strategic decision to slow
retail store expansion and focus on improving
retail operations. As a result, we now plan
to open just two new stores in 2008, one
in Scarborough, Maine, and the other in
Rapid City, South Dakota. Additionally,
we have spent a signifi cant amount of time
planning and designing our next generation
store, designed to be smaller, more effi cient
and more productive. Our Rapid City store,
scheduled to open in the third quarter, will be
our fi rst next generation store. You will be
hearing more about our next generation store
format in years to come.
From a retail operations perspective, we are
taking immediate action to improve results
across several key areas in the company.
We have launched four specifi c initiatives to
focus on improvements in advertising, retail
operations, margins and inventory. The
expected improvements from these initiatives
will go a long way in addressing key challenges
faced in 2007. We expect these initiatives
to have a signifi cant positive impact on our
2008 operating results.
(continued on inside)
Fiscal Year
(Dollars in thousands except per-share data) 2007 2006 2005
Total Revenue $2,349,599 $2,063,524 $1,799,661
Gross Profi t $971,213 $859,125 $735,339
Gross Profi t Margin 41.3% 41.6% 40.9%
Operating Income $151,092 $143,745 $114,963
Operating Income Margin 6.4% 7.0% 6.4%
Net Income $87,879 $85,785 $72,569
Diluted Earnings Per Share $1.31 $1.29 $1.10
Diluted Weighted Average Shares Outstanding 67,275,531 66,643,856 66,268,374
Total Cash and Cash Equivalents $131,182 $172,903 $86,923
Inventories $608,159 $484,414 $396,635
Economic Development Bonds $98,035 $117,360 $145,744
Total Debt $503,385 $317,873 $119,826
Total Stockholders’ Equity $828,559 $733,858 $639,853
Financial Highlights
’04
’05
’06
’07
’04
’05
’06
’07
’04
’05
’06
’07
Total Revenue ($ in millions)
Operating Income ($ in millions)
Net Income ($ in millions)
$1,556
$1,800
$2,064
$97
$115
$144
$65
$73
$86
$2,350
$151
$88