Cabela's 2007 Annual Report Download - page 41
Download and view the complete annual report
Please find page 41 of the 2007 Cabela's annual report below. You can navigate through the pages in the report by either clicking on the pages listed below, or by using the keyword search tool below to find specific information within the annual report.-
 1
1 -
2
-
3
-
4
-
5
-
6
-
7
-
8
-
9
-
10
-
11
-
12
-
13
-
14
-
15
-
16
-
17
-
18
-
19
-
20
-
21
-
22
-
23
-
24
-
25
-
26
-
27
-
28
-
29
-
30
-
 31
31 -
 32
32 -
 33
33 -
 34
34 -
 35
35 -
 36
36 -
 37
37 -
 38
38 -
 39
39 -
 40
40 -
 41
41 -
 42
42 -
 43
43 -
 44
44 -
 45
45 -
 46
46 -
 47
47 -
 48
48 -
 49
49 -
 50
50 -
 51
51 -
52
-
53
-
54
-
55
-
56
-
57
-
58
-
59
-
60
-
61
-
62
-
63
-
64
-
65
-
66
-
67
-
68
-
69
-
70
-
71
-
72
-
73
-
74
-
75
-
76
-
77
-
78
-
79
-
80
-
81
-
82
-
83
-
84
-
85
-
86
-
87
-
88
-
89
-
90
-
91
-
92
-
93
-
94
-
95
-
96
-
97
-
98
-
99
-
100
-
101
-
102
-
103
-
104
-
105
-
106
 |
 |

35
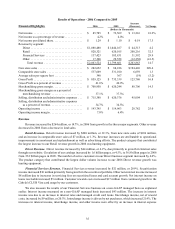
Results of Operations - 2006 Compared to 2005
Financial Highlights 2006 2005
Increase
(Decrease) % Change
(Dollars in Thousands)
Net income.................................. $ 85,785 $ 72,569 $ 13,216 18.2%
Net income as a percentage of revenue ............ 4.2% 4.0%
Net income per diluted share.................... $ 1.29 $ 1.10 $ 0.19 17.3
Revenue by segment:
Direct ................................... $1,088,480 $1,044,167 $ 44,313 4.2
Retail ................................... 820,321 620,105 200,216 32.3
Financial Services ......................... 137,423 105,831 31,592 29.9
Other.................................... 17,300 29,558 (12,258 ) (41.5)
Total revenue .......................... $2,063,524 $1,799,661 $ 263,863 14.7
New store sales .............................. $ 282,652 $ 88,226 $ 194,426 220.4
Comparable store sales ........................ 537,669 531,010 6,659 1.3
Average sales per square foot ................... 348 367 (19 ) (5.2)
Gross Profit ................................. $ 859,125 $ 735,339 123,786 16.8
Gross Profit as a percent of revenue .............. 41.6% 40.9%
Merchandising gross margin .................... $ 708,950 $ 620,244 88,706 14.3
Merchandising gross margin as a percent of
merchandising revenue ..................... 37.1% 37.3%
Selling, distribution and administrative expenses ... $ 715,380 $ 620,376 95,004 15.3
Selling, distribution and administrative expenses
as a percent of revenue...................... 34.7% 34.5%
Operating income ............................ $ 143,745 $ 114,963 28,782 25.0
Operating income margin ...................... 7.0% 6.4%
Revenue
Revenue increased by $264 million, or 14.7%, in 2006 from growth in the three major segments. Other revenue
decreased in 2006 from a decrease in land sales.
Retail Revenue. Retail revenue increased by $200 million, or 32.3%, from new store sales of $194 million,
and an increase in comparable store sales of $7 million, or 1.3%. Revenue increases are attributable to operational
improvements in assortment and replenishment as well as advertising efforts. The product category that contributed
the largest increase to our Retail revenue growth in 2006 was hunting equipment.
Direct Revenue. Direct revenue increased by $44 million, or 4.2%, due primarily to growth in Internet sales
through our website. Circulation of our catalogs increased by 1.6 billion pages, or 4.5%, to 36.8 billion pages in 2006
from 35.2 billion pages in 2005. The number of active customers in our Direct business segment increased by 4.6%.
The product category that contributed the largest dollar volume increase to our 2006 Direct revenue growth was
hunting equipment.
Financial Services Revenue. Financial Services revenue increased by $32 million, or 29.9%. Securitization
income increased $36 million primarily from growth in the securitized portfolio. Other non-interest income increased
$8 million due to increases in servicing fees on securitized loans and card account growth. Net interest income on
loans receivable increased $5 million. Customer rewards costs increased $17 million from continued growth in the
Cabela’s CLUB Visa card usage by our customers.
We also measure the results of our Financial Services business on a non-GAAP managed basis as explained
earlier. Interest income measured on a non-GAAP managed basis increased $43 million. The increase in interest
income was due to an increase in interest rates and managed credit card loans. Interchange income, net of reward
costs, increased by $9 million, or 20.3%. Interchange income is driven by net purchases, which increased 21.4%. The
increases in interest income, interchange income, and other income were offset by an increase in interest expense