Cabela's 2007 Annual Report Download - page 34
Download and view the complete annual report
Please find page 34 of the 2007 Cabela's annual report below. You can navigate through the pages in the report by either clicking on the pages listed below, or by using the keyword search tool below to find specific information within the annual report.-
 1
1 -
2
-
3
-
4
-
5
-
6
-
7
-
8
-
9
-
10
-
11
-
12
-
13
-
14
-
15
-
16
-
17
-
18
-
19
-
20
-
21
-
22
-
23
-
 24
24 -
 25
25 -
 26
26 -
 27
27 -
 28
28 -
 29
29 -
 30
30 -
 31
31 -
 32
32 -
 33
33 -
 34
34 -
 35
35 -
 36
36 -
 37
37 -
 38
38 -
 39
39 -
 40
40 -
 41
41 -
 42
42 -
 43
43 -
 44
44 -
45
-
46
-
47
-
48
-
49
-
50
-
51
-
52
-
53
-
54
-
55
-
56
-
57
-
58
-
59
-
60
-
61
-
62
-
63
-
64
-
65
-
66
-
67
-
68
-
69
-
70
-
71
-
72
-
73
-
74
-
75
-
76
-
77
-
78
-
79
-
80
-
81
-
82
-
83
-
84
-
85
-
86
-
87
-
88
-
89
-
90
-
91
-
92
-
93
-
94
-
95
-
96
-
97
-
98
-
99
-
100
-
101
-
102
-
103
-
104
-
105
-
106
 |
 |

28
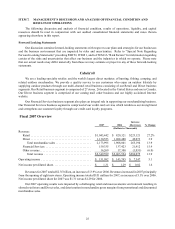
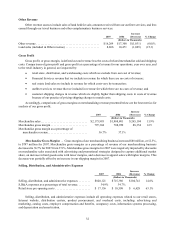
Growth of Our Credit Card Business – We seek to increase Financial Services revenue by attracting new
cardholders through low cost marketing efforts with our Retail and Direct businesses. We will continue to control
costs in our Financial Services segment by actively managing default rates, delinquencies, and charge-offs by
continuing our conservative underwriting and account management standards and practices.
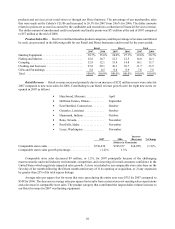
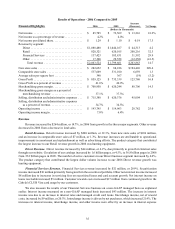
Operations Review
Our operating results expressed as a percentage of revenue were as follows for the years ended:
2007 2006 2005
Revenue .......................................................... 100.00% 100.00% 100.00%
Cost of revenue .................................................... 58.66 58.37 59.14
Gross profit (exclusive of depreciation and amortization) . . . . . . . . . . . . . . . . 41.34 41.63 40.86
Selling, distribution, and administrative expenses . . . . . . . . . . . . . . . . . . . . . . . . 34.90 34.67 34.47
Operating income .................................................. 6.44 6.96 6.39
Other income (expense):
Interest (expense) income, net ...................................... (0.80) (0.78) (0.57)
Other income, net ............................................... 0.29 0.47 0.59
Total other income (expense), net ...................................... (0.51) (0.31) 0.02
Income before provision for income taxes ............................... 5.93 6.65 6.41
Provision for income taxes . . . . . . . . . . . . . . . . . . . . . . . . . . . . . . . . . . . . . . . . . . 2.19 2.49 2.38
Net income ....................................................... 3.74% 4.16% 4.03%
Results of Operations - 2007 Compared to 2006
Revenues
2007 %2006 %
Increase
(Decrease) % Change
(Dollars in Thousands)
Retail . . . . . . . . . . . . . . . . . . . . . . . . . . . . . . $1,043,442 44.4% $ 820,321 39.8% $ 223,121 27.2%
Direct . . . . . . . . . . . . . . . . . . . . . . . . . . . . . 1,130,553 48.1 1,088,480 52.7 42,073 3.9
Financial Services . . . . . . . . . . . . . . . . . . . . 159,335 6.8 137,423 6.7 21,912 15.9
Other . . . . . . . . . . . . . . . . . . . . . . . . . . . . . . 16,269 0.7 17,300 0.8 (1,031) (6.0)
$2,349,599 100.0% $2,063,524 100.0% $ 286,075 13.9%
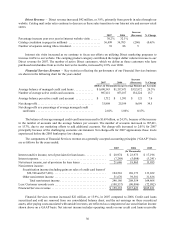
Retail revenue includes sales and services at our retail stores. Direct revenue includes sales from orders placed
over the phone, by mail, and through our website and customer shipping charges. Financial Services revenue is
comprised of securitization income, interest income, and interchange and other fees, net of reward program costs,
interest expense, and credit losses from our credit card operations. Other revenue consists principally of sales of land
surrounding our retail store developments and fees collected from our other real estate, outfitter services, and travel
businesses.
In 2007, our Retail and Direct sales were impacted by a challenging retail and macroeconomic environment.
However, revenue increased in 2007 in all three of our primary business segments but declined for our Other segment
primarily due to a decrease in land sales in 2007 compared to 2006. Retail sales increased due to our new store
openings. Direct revenue increased primarily from efforts to increase traffic to our website. Financial Services
revenue growth was driven by growth in the number of average active credit card accounts and average managed
credit card loans.
Revenue from the sale of gift certificates and gift cards is recognized in earnings when the gift certificates
and gift cards are redeemed for merchandise or services. Our gift instrument liability at the end of 2007 was $113
million compared to $87 million at the end of 2006. Customers also receive points for purchases at our retail stores or
through our Direct business on various loyalty programs. In addition, our Cabela’s CLUB Visa card loyalty program
allows customers to earn points whenever and wherever they use their credit card, and then redeem earned points for