Cabela's 2007 Annual Report Download - page 46
Download and view the complete annual report
Please find page 46 of the 2007 Cabela's annual report below. You can navigate through the pages in the report by either clicking on the pages listed below, or by using the keyword search tool below to find specific information within the annual report.-
 1
1 -
2
-
3
-
4
-
5
-
6
-
7
-
8
-
9
-
10
-
11
-
12
-
13
-
14
-
15
-
16
-
17
-
18
-
19
-
20
-
21
-
22
-
23
-
24
-
25
-
26
-
27
-
28
-
29
-
30
-
31
-
32
-
33
-
34
-
35
-
 36
36 -
 37
37 -
 38
38 -
 39
39 -
 40
40 -
 41
41 -
 42
42 -
 43
43 -
 44
44 -
 45
45 -
 46
46 -
 47
47 -
 48
48 -
 49
49 -
 50
50 -
 51
51 -
 52
52 -
 53
53 -
 54
54 -
 55
55 -
 56
56 -
57
-
58
-
59
-
60
-
61
-
62
-
63
-
64
-
65
-
66
-
67
-
68
-
69
-
70
-
71
-
72
-
73
-
74
-
75
-
76
-
77
-
78
-
79
-
80
-
81
-
82
-
83
-
84
-
85
-
86
-
87
-
88
-
89
-
90
-
91
-
92
-
93
-
94
-
95
-
96
-
97
-
98
-
99
-
100
-
101
-
102
-
103
-
104
-
105
-
106
 |
 |

40
and the liability for gift certificates and credit card reward points increased $17 million over 2006 from increased
sales of gift cards. In addition, depreciation and amortization increased $14 million offsetting cash used in operating
activities.
We will incur a total cash outlay of approximately $19 million over four years based on our election in our
2007 federal income tax return to change our method of accounting for inventory from LIFO to FIFO for income tax
purposes. At the end of 2007, we owed approximately $14 million, which is included in the current portion of deferred
income taxes payable in our consolidated balance sheet.
Investing Activities – Cash used in investing activities increased $187 million for 2007 compared to 2006.
This net increase was primarily due to expenditures related to the development and construction of new retail stores
in 2007. For 2007, cash paid for property and equipment additions totaled $336 million. At December 29, 2007, we
estimated total capital expenditures, including the purchase of economic development bonds, to be in the range of
approximately $100-$125 million to be paid in 2008 relating to the development, construction, and completion of
retail stores. Certain contractual aspects of our retail store locations are in various stages of negotiations, and are
subject to customary conditions to closing. Economic development bonds totaling $1 million relating to our Lehi,
Utah, retail store were redeemed in 2007. In addition, economic development bonds totaling $43 million and $53
million relating to our Wheeling, West Virginia, retail store and distribution center were retired during 2007 and
2006, respectively.
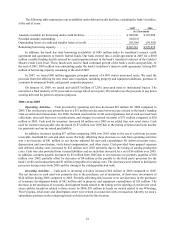
The following table highlights the growth of our retail stores, and the activity of economic development bonds
related to the construction of these stores and related projects, for the years ended:
2007 2006
(Dollars In Thousands)
Property and equipment additions . . . . . . . . . . . . . . . . . . . . . . . . . . . . . . . . . . . . . . . . . . . . . $ 335,644 $ 179,238
Purchases of economic development bonds ...................................... 36,223 23,397
Acquisition of outdoor equipment retailer, net of cash acquired ...................... 9,277 —
Total .................................................................. $ 381,144 $ 202,635
Proceeds from retirements and maturities of economic development bonds . . . . . . . . . . . . $ 45,427 $ 54,065
Number of new retail stores opened and acquired during the year . . . . . . . . . . . . . . . . . . . 9 4
Number of retail stores at the end of the year .................................... 27 18
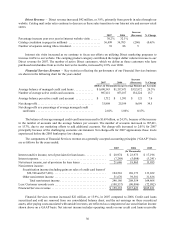
Financing Activities – Cash provided by financing activities increased $82 million for 2007 compared to
2006. This net increase from financing activities comparing periods was due to a net increase of $66 million in time
deposits, the bank increasing its short-term borrowings to $100 million to fund its credit card operations, and a net
increase of $35 million in borrowings primarily on lines of credit related to new stores which opened in 2007. In
addition, unpresented checks net of bank balance increased $33 million due to timing of when checks cleared our
bank. Partially offsetting these increases was a net decrease of $152 million in long-term debt ($215 million borrowed
in 2006) used to support our retail store expansion.
The following table highlights the borrowing activity of our merchandising business and bank operations for
the years ended:
2007 2006
(In Thousands)
Borrowings on lines of credit and short-term debt, net of repayments ................. $ 49,691 $ 14,877
Borrowing on variable funding facility – financial services subsidiary ................ 100,000 —
Issuances of long-term debt, net of repayments ................................... 33,792 185,907
Total .................................................................. $183,483 $200,784