Cabela's 2007 Annual Report Download - page 86
Download and view the complete annual report
Please find page 86 of the 2007 Cabela's annual report below. You can navigate through the pages in the report by either clicking on the pages listed below, or by using the keyword search tool below to find specific information within the annual report.-
 1
1 -
2
-
3
-
4
-
5
-
6
-
7
-
8
-
9
-
10
-
11
-
12
-
13
-
14
-
15
-
16
-
17
-
18
-
19
-
20
-
21
-
22
-
23
-
24
-
25
-
26
-
27
-
28
-
29
-
30
-
31
-
32
-
33
-
34
-
35
-
36
-
37
-
38
-
39
-
40
-
41
-
42
-
43
-
44
-
45
-
46
-
47
-
48
-
49
-
50
-
51
-
52
-
53
-
54
-
55
-
56
-
57
-
58
-
59
-
60
-
61
-
62
-
63
-
64
-
65
-
66
-
67
-
68
-
69
-
70
-
71
-
72
-
73
-
74
-
75
-
 76
76 -
 77
77 -
 78
78 -
 79
79 -
 80
80 -
 81
81 -
 82
82 -
 83
83 -
 84
84 -
 85
85 -
 86
86 -
 87
87 -
 88
88 -
 89
89 -
 90
90 -
 91
91 -
 92
92 -
 93
93 -
 94
94 -
 95
95 -
 96
96 -
97
-
98
-
99
-
100
-
101
-
102
-
103
-
104
-
105
-
106
 |
 |

80
CABELA’S INCORPORATED AND SUBSIDIARIES
NOTES TO CONSOLIDATED FINANCIAL STATEMENTS
(Dollars in Thousands Except Share and Per Share Amounts)
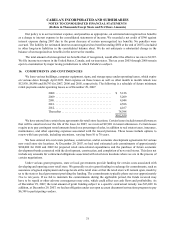
Revenues included in Corporate Overhead and Other are primarily made up of land sales. Corporate Overhead
and Other expenses include unallocated shared-service costs, operations of various ancillary subsidiaries such as real
estate development and travel, and eliminations. Unallocated shared-service costs include receiving, distribution, and
storage costs of inventory, merchandising, and quality assurance costs, as well as corporate headquarters occupancy
costs.
Segment assets are those directly used in or clearly allocable to an operating segment’s operations. For the
Retail segment, assets primarily include inventory in the retail stores, land, buildings, fixtures, and leasehold
improvements. For the Direct segment, assets primarily include deferred catalog costs and fixed assets. Included in
the assets of the Direct and Retail segments is goodwill of $4,474 that has been allocated $969 to the Direct segment
and $3,505 to the Retail segment as of December 29, 2007. For the Financial Services segment, assets primarily
include cash, credit card loans, retained interest, buildings, and fixtures. Corporate and other assets include corporate
headquarters, merchandise distribution inventory, shared technology infrastructure, as well as corporate cash and
cash equivalents, economic development bonds, prepaid expenses, and other assets. Depreciation, amortization, and
property and equipment expenditures of each segment are allocated to each respective segment. Unallocated assets
include corporate cash and cash equivalents, merchandise distribution inventory for the Retail or Direct segments,
the net book value of corporate facilities and related information systems, deferred income taxes, and other corporate
long-lived assets. The accounting policies of the segments, where applicable, are the same as those described in the
summary of significant accounting policies in our notes to consolidated financial statements. Intercompany revenue
between segments has been eliminated in consolidation.
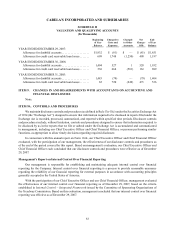
Results by business segment are presented in the following tables for 2007, 2006 and 2005:
Fiscal Year 2007 Retail Direct
Financial
Services
Corporate
Overhead
and Other Tot al
Revenue from external ................ $ 1,040,664 $ 1,127,942 $159,943 $ 21,050 $ 2,349,599
Revenue (loss) from internal ............ 2,778 2,611 (608) (4,781) —
Total revenue ..................... $1,043,442 $ 1,130,553 $159,335 $ 16,269 $2,349,599
Operating income (loss)................ $ 127,744 $ 190,046 $ 37,448 $(204,146) $ 151,092
As a percentage of revenue .......... 12.2% 16.8% 23.5% N/A 6.4%
Depreciation and amortization .......... $ 29,830 $ 4,462 $ 1,129 $ 24,442 $ 59,863
Assets.............................. 1,065,234 480,341 450,616 216,639 2,212,830
Property and equipment additions
including accrued amounts .......... 324,272 8,466 1,037 30,551 364,326
Fiscal Year 2006 Retail Direct
Financial
Services
Corporate
Overhead
and Other Tot al
Revenue from external ................ $817,836 $1,086,162 $138,164 $ 21,362 $2,063,524
Revenue (loss) from internal ............ 2,485 2,318 (741) (4,062) —
Total revenue ..................... $820,321 $ 1,088,480 $137,423 $ 17,300 $ 2,063,524
Operating income (loss)................ $124,122 $ 179,182 $ 30,061 $(189,620) $ 143,745
As a percentage of revenue .......... 15.1% 16.5% 21.9% N/A 7.0%
Depreciation and amortization .......... $ 19,050 $ 4,371 $ 941 $ 21,197 $ 45,559
Assets.............................. 602,513 496,963 316,417 335,337 1,751,230
Property and equipment additions
including accrued amounts .......... 161,585 5,680 1,735 21,592 190,592