Cabela's 2007 Annual Report Download - page 37
Download and view the complete annual report
Please find page 37 of the 2007 Cabela's annual report below. You can navigate through the pages in the report by either clicking on the pages listed below, or by using the keyword search tool below to find specific information within the annual report.-
 1
1 -
2
-
3
-
4
-
5
-
6
-
7
-
8
-
9
-
10
-
11
-
12
-
13
-
14
-
15
-
16
-
17
-
18
-
19
-
20
-
21
-
22
-
23
-
24
-
25
-
26
-
 27
27 -
 28
28 -
 29
29 -
 30
30 -
 31
31 -
 32
32 -
 33
33 -
 34
34 -
 35
35 -
 36
36 -
 37
37 -
 38
38 -
 39
39 -
 40
40 -
 41
41 -
 42
42 -
 43
43 -
 44
44 -
 45
45 -
 46
46 -
 47
47 -
48
-
49
-
50
-
51
-
52
-
53
-
54
-
55
-
56
-
57
-
58
-
59
-
60
-
61
-
62
-
63
-
64
-
65
-
66
-
67
-
68
-
69
-
70
-
71
-
72
-
73
-
74
-
75
-
76
-
77
-
78
-
79
-
80
-
81
-
82
-
83
-
84
-
85
-
86
-
87
-
88
-
89
-
90
-
91
-
92
-
93
-
94
-
95
-
96
-
97
-
98
-
99
-
100
-
101
-
102
-
103
-
104
-
105
-
106
 |
 |

31
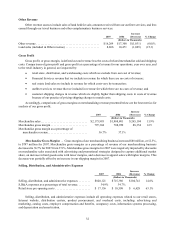
we own. Non-interest income includes servicing income, gains on sales of loans, and income recognized on our
retained interests, as well as interchange income on the entire managed portfolio. Excluding the effect of gains on
the sale of credit card loans, securitization income increased $20 million over 2006, due primarily to growth in the
securitized loan portfolio. Other non-interest income increased $12 million primarily from increases in servicing
fees on securitized loans year over year and account growth. Customer rewards costs increased $18 million from
continued growth in the Cabela’s CLUB Visa card usage by our customers.
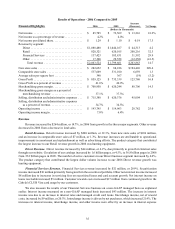
Managed credit card loans of the Financial Services business segment include both credit card loans receivable
we own and securitized credit card loans. The process by which credit card loans are securitized converts interest
income, interchange income, credit card fees, credit losses, and other income and expenses on the securitized loans
into securitization income. Because the financial performance of the total managed portfolio has a significant impact
on earnings we receive from servicing the portfolio, management believes evaluating the components of Financial
Services revenue for both owned loans and securitized loans is important to analyzing results.
Non-GAAP Presentation – The “non-GAAP” presentation shown below presents the financial performance
of the total managed portfolio of credit card loans. Although our consolidated financial statements are not presented
in this manner, we review the performance of the managed portfolio as presented below. Interest income, interchange
income (net of customer rewards), and fee income on both the owned and securitized portfolio are reflected in the
respective line items. Interest paid to outside investors on the securitized credit card loans is included in interest
expense. Credit losses on the entire managed portfolio are reflected in the provision for loan losses.
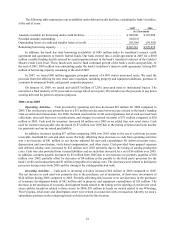
The following table sets forth the revenue components of our Financial Services segment managed portfolio on
a non-GAAP basis for the years ended:
2007 2006 2005
(Dollars in Thousands)
Interest income .............................................. $186,341 $145,425 $102,824
Interchange income, net of customer rewards costs .................. 62,066 51,086 42,468
Other fee income ............................................ 27,233 22,829 20,738
Interest expense . . . . . . . . . . . . . . . . . . . . . . . . . . . . . . . . . . . . . . . . . . . . . (83,120) (64,910) (41,654)
Provision for loan losses ....................................... (35,415) (26,064) (24,254)
Other ...................................................... 2,230 9,057 5,709
Managed Financial Services revenue ............................. $159,335 $137,423 $105,831
Managed Financial Services Revenue as a Percentage of Average Managed Credit Card Loans:
Interest income .............................................. 11.0% 10.7% 9.4%
Interchange income, net of customer rewards costs .................. 3.7 3.8 3.9
Other fee income ............................................ 1.6 1.7 1.9
Interest expense ............................................. (4.9) (4.8) (3.8)
Provision for loan losses ....................................... (2.1) (1.9) (2.2)
Other ...................................................... 0.1 0.6 0.5
Managed Financial Services revenue ............................. 9.4% 10.1% 9.7%
The increase in interest income of $41 million in 2007 from 2006 was due to an increase in interest rates and
managed credit card loans. The increase in interchange income of $11 million in 2007 from 2006 was driven by net
credit card purchases, which increased 20.6%. Other fee income increased $4 million due to increases of $2 million
in late fees and $2 million in payment assurance fees. The increases in interest income and interchange income were
offset by an increase in interest expense of $18 million from increases in securitized credit card loans, borrowings,
and interest rates, and by an increase in loan losses of $9 million because of increases in managed credit card loans
and increases in net charge-offs.