Cabela's 2007 Annual Report Download - page 82
Download and view the complete annual report
Please find page 82 of the 2007 Cabela's annual report below. You can navigate through the pages in the report by either clicking on the pages listed below, or by using the keyword search tool below to find specific information within the annual report.-
 1
1 -
2
-
3
-
4
-
5
-
6
-
7
-
8
-
9
-
10
-
11
-
12
-
13
-
14
-
15
-
16
-
17
-
18
-
19
-
20
-
21
-
22
-
23
-
24
-
25
-
26
-
27
-
28
-
29
-
30
-
31
-
32
-
33
-
34
-
35
-
36
-
37
-
38
-
39
-
40
-
41
-
42
-
43
-
44
-
45
-
46
-
47
-
48
-
49
-
50
-
51
-
52
-
53
-
54
-
55
-
56
-
57
-
58
-
59
-
60
-
61
-
62
-
63
-
64
-
65
-
66
-
67
-
68
-
69
-
70
-
71
-
 72
72 -
 73
73 -
 74
74 -
 75
75 -
 76
76 -
 77
77 -
 78
78 -
 79
79 -
 80
80 -
 81
81 -
 82
82 -
 83
83 -
 84
84 -
 85
85 -
 86
86 -
 87
87 -
 88
88 -
 89
89 -
 90
90 -
 91
91 -
 92
92 -
93
-
94
-
95
-
96
-
97
-
98
-
99
-
100
-
101
-
102
-
103
-
104
-
105
-
106
 |
 |

76
CABELA’S INCORPORATED AND SUBSIDIARIES
NOTES TO CONSOLIDATED FINANCIAL STATEMENTS
(Dollars in Thousands Except Share and Per Share Amounts)
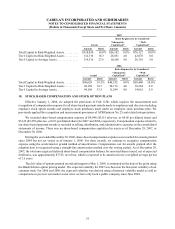
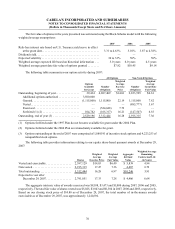
The fair value of options in the years presented was estimated using the Black-Scholes model with the following
weighted average assumptions:
2007 2006 2005
Risk-free interest rate based on U.S. Treasury yield curve in effect
at the grant date ....................................... 3.31 to 4.63% 5.01% 3.87 to 4.38%
Dividend yield ........................................... — — —
Expected volatility . . . . . . . . . . . . . . . . . . . . . . . . . . . . . . . . . . . . . . . 30 to 33% 50% 50%
Weighted average expected life based on historical information . . . 5.0 years 6.0 years 4.5 years
Weighted average grant date fair value of options granted . . . . . . . . $7.82 $10.45 $9.14
The following table summarizes our option activity during 2007:
Options
Available
for Grant
All Options Non-Vested Options
Number
of Options
Weighted
Average
Exercise
Price
Number
of Options
Weighted
Average
Grant Date
Fair Value
Outstanding, beginning of year................ 39,434 4,887,409 $14.01 2,833,599 $6.61
Additional options authorized .............. 3,500,000
Granted................................ (1,115,000) 1,115,000 22.19 1,115,000 7.82
Vested ................................. — — — (885,777) 5.67
Exercised .............................. — (524,648) 7.72 — —
Forfeited (1) (2) ......................... 104,762 (165,317) 16.21 (147,507) 6.55
Outstanding, end of year (3) .................. 2,529,196 5,312,444 16.28 2,915,315 7.36
(1) Options forfeited under the 1997 Plan do not become available for grant under the 2004 Plan.
(2) Options forfeited under the 2004 Plan are immediately available for grant.
(3) Options outstanding at the end of 2007 were comprised of 1,089,191 of incentive stock options and 4,223,253 of
nonqualified stock options.
The following table provides information relating to our equity share-based payment awards at December 29,
2007:
Shares
Weighted
Average
Exercise Price
Weighted
Average
Fair Value
Aggregate
Intrinsic
Value
Weighted Average
Remaining
Contractual Life
(in Years)
Vested and exercisable . . . . . . . . . . . . . . . . . 2,397,129 $14.83 $6.49 $ 5,839 4.94
Non-vested . . . . . . . . . . . . . . . . . . . . . . . . . . 2,915,315 17.47 7.36 4,407 6.72
Total outstanding . . . . . . . . . . . . . . . . . . . . . 5,312,444 16.28 6.97 $10,246 5.91
Expected to vest after
December 29, 2007 ................. 2,791,051 17.33 7.28 $ 4,406 6.64
The aggregate intrinsic value of awards exercised was $8,188, $3,473 and $1,000 during 2007, 2006 and 2005,
respectively. The total fair value of shares vested was $5,025, $3,843 and $6,304 in 2007, 2006 and 2005, respectively.
Based on our closing stock price of $14.80 as of December 29, 2007, the total number of in-the-money awards
exercisable as of December 29, 2007, was approximately 1,241,694.