Cabela's 2007 Annual Report Download - page 42
Download and view the complete annual report
Please find page 42 of the 2007 Cabela's annual report below. You can navigate through the pages in the report by either clicking on the pages listed below, or by using the keyword search tool below to find specific information within the annual report.-
 1
1 -
2
-
3
-
4
-
5
-
6
-
7
-
8
-
9
-
10
-
11
-
12
-
13
-
14
-
15
-
16
-
17
-
18
-
19
-
20
-
21
-
22
-
23
-
24
-
25
-
26
-
27
-
28
-
29
-
30
-
31
-
 32
32 -
 33
33 -
 34
34 -
 35
35 -
 36
36 -
 37
37 -
 38
38 -
 39
39 -
 40
40 -
 41
41 -
 42
42 -
 43
43 -
 44
44 -
 45
45 -
 46
46 -
 47
47 -
 48
48 -
 49
49 -
 50
50 -
 51
51 -
 52
52 -
53
-
54
-
55
-
56
-
57
-
58
-
59
-
60
-
61
-
62
-
63
-
64
-
65
-
66
-
67
-
68
-
69
-
70
-
71
-
72
-
73
-
74
-
75
-
76
-
77
-
78
-
79
-
80
-
81
-
82
-
83
-
84
-
85
-
86
-
87
-
88
-
89
-
90
-
91
-
92
-
93
-
94
-
95
-
96
-
97
-
98
-
99
-
100
-
101
-
102
-
103
-
104
-
105
-
106
 |
 |
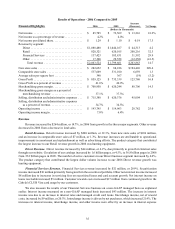
36
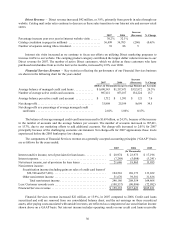
of $23 million due to increases in securitized credit card loans, borrowings, and interest rates. Compared to 2005,
the number of average active accounts in 2006 grew by 17.5% to 853,187, and the average balance per active account
grew by 5.5% to $1,591.
Gross Profit
Gross profit increased by $124 million, or 16.8%, to $859 million for 2006. Financial Services revenue growth
of $32 million resulted in a gross profit percentage increase of 0.5%. Sales of land at higher gross profit margins in
2006 resulted in a gross profit percentage increase of 0.4%. These increases were offset by a decline in merchandising
gross profits discussed below.
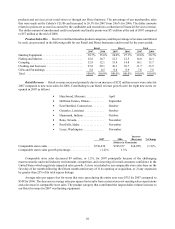
Merchandising Gross Margin. Gross margin for our merchandising business increased by $89 million, or
14.3%, to $709 million for 2006. Better merchandising practices, increased sales of our Cabela’s branded merchandise,
and other operations improvements resulted in increased gross margins. These improvements, however, were largely
offset by an increase in sales discounts. Increased discounts, representing 0.7% of merchandise revenue, resulted
from our promotional gift card campaign in our Retail segment and a new promotional campaign in the Direct
business segment. Our shipping margin – the shipping income we collect less the cost we pay to ship merchandise to
our customers – declined, representing 0.3% of merchandise revenue. The primary reason for the decline in shipping
margin was the implementation of our new warehouse management software, causing us to ship more packages per
order due to the inability to transfer products between distribution centers during the software phase-in period.
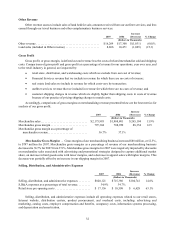
Selling, Distribution, and Administrative Expenses
Selling, distribution, and administrative expenses increased by $95 million, or 15.3%, to $715 million for 2006.
We recognized $4 million of stock based compensation expense in 2006, which primarily accounted for the 0.20%
increase in selling, distribution, and administrative expenses as a percentage of total revenue. The most significant
factors contributing to the increase in selling, distribution, and administrative expenses also included:
Retail Business Segment:
• New store operating costs for new stores that were not open in the comparable period of 2005 increased
by $37 million.
• A decrease in comparable store salaries and wages and related benefits of $1 million resulting from a
focus on labor scheduling practices.
Direct Business Segment:
• An increase in catalog costs of $8 million from higher postage and print rates and the addition of three
catalogs not circulated in 2005. As a percentage of Direct revenue, catalog costs increased to 14.7% in
2006 from 14.5% in 2005.
• Increases in salary, wages, and related benefits in the Direct business segment of $3 million for positions
added to support our growth.
• Increases in incidental equipment and software expenses of $3 million specifically related to our
website.
• An increase in Direct advertising costs of $3 million primarily from a new postcard promotion.
Financial Services:
• Advertising and promotional costs increased by $7 million from increases in new account acquisition
costs and increases in Visa charges driven by increases in credit card transactions.
• Third party data processing services for credit card processing increased by $2 million as the number of
credit card accounts and credit card transactions increased.
• Postage increases of $1 million from increases in the number of accounts and postage rate increases.