Cabela's 2007 Annual Report Download - page 85
Download and view the complete annual report
Please find page 85 of the 2007 Cabela's annual report below. You can navigate through the pages in the report by either clicking on the pages listed below, or by using the keyword search tool below to find specific information within the annual report.-
 1
1 -
2
-
3
-
4
-
5
-
6
-
7
-
8
-
9
-
10
-
11
-
12
-
13
-
14
-
15
-
16
-
17
-
18
-
19
-
20
-
21
-
22
-
23
-
24
-
25
-
26
-
27
-
28
-
29
-
30
-
31
-
32
-
33
-
34
-
35
-
36
-
37
-
38
-
39
-
40
-
41
-
42
-
43
-
44
-
45
-
46
-
47
-
48
-
49
-
50
-
51
-
52
-
53
-
54
-
55
-
56
-
57
-
58
-
59
-
60
-
61
-
62
-
63
-
64
-
65
-
66
-
67
-
68
-
69
-
70
-
71
-
72
-
73
-
74
-
 75
75 -
 76
76 -
 77
77 -
 78
78 -
 79
79 -
 80
80 -
 81
81 -
 82
82 -
 83
83 -
 84
84 -
 85
85 -
 86
86 -
 87
87 -
 88
88 -
 89
89 -
 90
90 -
 91
91 -
 92
92 -
 93
93 -
 94
94 -
 95
95 -
96
-
97
-
98
-
99
-
100
-
101
-
102
-
103
-
104
-
105
-
106
 |
 |

79
CABELA’S INCORPORATED AND SUBSIDIARIES
NOTES TO CONSOLIDATED FINANCIAL STATEMENTS
(Dollars in Thousands Except Share and Per Share Amounts)
Other Comprehensive Income (Loss) – The components of accumulated other comprehensive income (loss),
net of related taxes, are as follows for the years ended:
2007 2006
Accumulated net unrealized holding gains (losses) on available-for-sale bonds . . . . . . . . . . . . . . $(806) $292
Accumulated net unrealized holding gains on derivatives . . . . . . . . . . . . . . . . . . . . . . . . . . . . . . . 76 23
Cumulative foreign currency translation adjustment .................................... 7 —
Total accumulated other comprehensive income (loss) . . . . . . . . . . . . . . . . . . . . . . . . . . . . . . . . . . $(723) $315
21. EARNINGS PER SHARE
The following table reconciles the number of shares utilized in the earnings per share calculations for the years
ended:
2007 2006 2005
Weighted average number of shares:
Common shares – basic ................................... 65,744,077 65,221,339 64,668,973
Effect of incremental dilutive securities:
Stock options and employee stock purchase plan shares .... 1,531,454 1,422,517 1,599,401
Common shares – diluted.................................. 67,275,531 66,643,856 66,268,374
Options outstanding considered anti-dilutive ..................... 1,048,000 6,000 1,444,186
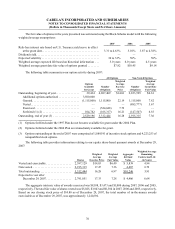
22. SUPPLEMENTAL CASH FLOW INFORMATION
The following table sets forth non-cash financing and investing activities and other cash flow information for
the years ended:
2007 2006 2005
Non-cash financing and investing activities:
Accrued property and equipment additions (1).......................... $48,534 $19,852 $8,498
Capital lease obligations ........................................... 201 5,649 —
Contribution of land............................................... 19,000 — —
Other cash flow information:
Interest paid .................................................. $30,273 $19,017 $14,968
Capitalized interest ............................................ (4,069)(355)(371)
Interest paid, net of capitalized interest ............................. $26,204 $18,662 $14,597
Income taxes, net .............................................. $33,575 $41,012 $38,354
(1) Accrued property and equipment additions are recognized in the consolidated statements of cash flows in the
period they are paid.
23. SEGMENT REPORTING
We have three reportable segments: Retail, Direct, and Financial Services. The Retail segment sells products
and services through our retail stores; the Direct segment sells products through direct mail catalogs and e-commerce
websites (Cabelas.com and complementary websites); and the Financial Services segment issues co-branded credit
cards. For the Retail segment, operating costs primarily consist of labor, advertising, depreciation, and occupancy
costs of retail stores. For the Direct segment, operating costs primarily consist of catalog costs, e-commerce
advertising costs, and order processing costs. For the Financial Services segment, operating costs primarily consist
of advertising and promotion, marketing fees, third party services for processing credit card transactions, salaries,
and other general and administrative costs.