Cabela's 2007 Annual Report Download - page 72
Download and view the complete annual report
Please find page 72 of the 2007 Cabela's annual report below. You can navigate through the pages in the report by either clicking on the pages listed below, or by using the keyword search tool below to find specific information within the annual report.-
 1
1 -
2
-
3
-
4
-
5
-
6
-
7
-
8
-
9
-
10
-
11
-
12
-
13
-
14
-
15
-
16
-
17
-
18
-
19
-
20
-
21
-
22
-
23
-
24
-
25
-
26
-
27
-
28
-
29
-
30
-
31
-
32
-
33
-
34
-
35
-
36
-
37
-
38
-
39
-
40
-
41
-
42
-
43
-
44
-
45
-
46
-
47
-
48
-
49
-
50
-
51
-
52
-
53
-
54
-
55
-
56
-
57
-
58
-
59
-
60
-
61
-
 62
62 -
 63
63 -
 64
64 -
 65
65 -
 66
66 -
 67
67 -
 68
68 -
 69
69 -
 70
70 -
 71
71 -
 72
72 -
 73
73 -
 74
74 -
 75
75 -
 76
76 -
 77
77 -
 78
78 -
 79
79 -
 80
80 -
 81
81 -
 82
82 -
83
-
84
-
85
-
86
-
87
-
88
-
89
-
90
-
91
-
92
-
93
-
94
-
95
-
96
-
97
-
98
-
99
-
100
-
101
-
102
-
103
-
104
-
105
-
106
 |
 |

66
CABELA’S INCORPORATED AND SUBSIDIARIES
NOTES TO CONSOLIDATED FINANCIAL STATEMENTS
(Dollars in Thousands Except Share and Per Share Amounts)
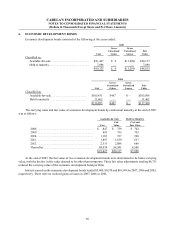
6. ECONOMIC DEVELOPMENT BONDS
Economic development bonds consisted of the following at the years ended:
2007
Cost
Gross
Unrealized
Gains
Gross
Unrealized
Losses
Fair
Value
Classified as:
Available-for-sale .......................... $91,427 $ 9 $(1,299) $90,137
Held to maturity ........................... 7,898 — — 7,898
$99,325 $ 9 $(1,299) $98,035
2006
Cost
Gross
Unrealized
Gains
Gross
Unrealized
Losses
Fair
Value
Classified as:
Available-for-sale ........................ $105,431 $467 $— $105,898
Held to maturity ......................... 11,462 — — 11,462
$116,893 $467 $— $117,360
The carrying value and fair value of economic development bonds by contractual maturity at the end of 2007
was as follows:
Available-for-Sale Held to Maturity
Cost
Fair
Value
Cost and
Fair Value
2008 ...................................... $ 847 $ 759 $ 702
2009 ...................................... 895 755 703
2010 ....................................... 1,183 917 590
2011 ....................................... 1,897 1,079 637
2012 ....................................... 2,531 2,086 686
Thereafter .................................. 84,074 84,541 4,580
$91,427 $90,137 $7,898
At the end of 2007, the fair value of two economic development bonds were determined to be below carrying
value, with the decline in fair value deemed to be other than temporary. These fair value adjustments totaling $6,733
reduced the carrying value of the economic development bond portfolio.
Interest earned on the economic development bonds totaled $5,680, $9,574 and $10,549 for 2007, 2006 and 2005,
respectively. There were no realized gains or losses in 2007, 2006 or 2005.