Cabela's 2007 Annual Report Download - page 40
Download and view the complete annual report
Please find page 40 of the 2007 Cabela's annual report below. You can navigate through the pages in the report by either clicking on the pages listed below, or by using the keyword search tool below to find specific information within the annual report.-
 1
1 -
2
-
3
-
4
-
5
-
6
-
7
-
8
-
9
-
10
-
11
-
12
-
13
-
14
-
15
-
16
-
17
-
18
-
19
-
20
-
21
-
22
-
23
-
24
-
25
-
26
-
27
-
28
-
29
-
 30
30 -
 31
31 -
 32
32 -
 33
33 -
 34
34 -
 35
35 -
 36
36 -
 37
37 -
 38
38 -
 39
39 -
 40
40 -
 41
41 -
 42
42 -
 43
43 -
 44
44 -
 45
45 -
 46
46 -
 47
47 -
 48
48 -
 49
49 -
 50
50 -
51
-
52
-
53
-
54
-
55
-
56
-
57
-
58
-
59
-
60
-
61
-
62
-
63
-
64
-
65
-
66
-
67
-
68
-
69
-
70
-
71
-
72
-
73
-
74
-
75
-
76
-
77
-
78
-
79
-
80
-
81
-
82
-
83
-
84
-
85
-
86
-
87
-
88
-
89
-
90
-
91
-
92
-
93
-
94
-
95
-
96
-
97
-
98
-
99
-
100
-
101
-
102
-
103
-
104
-
105
-
106
 |
 |

34
Corporate Overhead, Distribution Centers, and Other:
•An increase in employee compensation and benefits of $9 million from the expansion and improvement
of our infrastructure to support our growth.
•Depreciation expense increase of $3 million on information system upgrades implemented in 2006 and
2007.
•An increase in contract labor costs and software expense of $1 million on information system upgrades
and expansion.
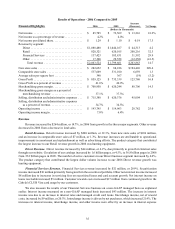
Operating Income
Operating income is revenue less cost of revenue and selling, distribution, and administrative expenses.
Operating income for our business segments excludes costs associated with operating expenses of distribution
centers, procurement activities, and other corporate overhead costs.
2007 2006
Increase
(Decrease) % Change
(Dollars in Thousands)
Total operating income ............................... $151,092 $143,745 $ 7,347 5.1%
Total operating income as a percentage of total revenue ..... 6.4% 7.0%
Operating income by business segment:
Retail .......................................... $127,744 $124,122 3,622 2.9
Direct .......................................... 190,046 179,182 10,864 6.1
Financial Services ................................ 37,448 30,061 7,387 24.6
Operating income as a percentage of segment revenue:
Retail .......................................... 12.2% 15.1%
Direct .......................................... 16.8 16.5
Financial Services ................................ 23.5 21.9
Operating income increased $7 million, or 5.1%, for 2007. Operating income as a percentage of revenue decreased
to 6.4% for 2007 from 7.0% for 2006. Operating income comparisons between 2007 and 2006 are impacted by 1) the
addition of new retail stores in 2007 and 2006, 2) sales increases for our Direct business, and 3) the profitability of
our Financial Services business segment. The Financial Services segment incurs a marketing fee paid to the Retail
and Direct business segments. This marketing fee is included in selling, distribution, and administrative expenses as
an expense for the Financial Services segment and as a credit to expense for the Retail and Direct business segments.
The marketing fee paid by the Financial Services segment to these two business segments increased $4 million in
2007 compared to 2006 – a $1 million increase to the Direct business segment and a $3 million increase to the Retail
segment.
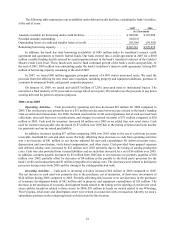
Interest (Expense) Income, Net
Interest expense, net of interest income, increased $3 million to $19 million for 2007 compared to 2006. The net
increase in interest expense was primarily due to additional debt incurred for financing our retail store expansion.
During 2007, we capitalized interest totaling $4 million on qualifying fixed assets relating primarily to retail store
construction compared to $0.4 million during 2006.
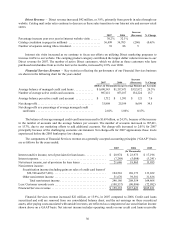
Other Non-Operating Income, Net
Other income decreased $3 million to $7 million for 2007 from $10 million in 2006 due to a decrease in interest
earned on economic development bonds. Our investment in economic development bonds was lower in 2007 than
2006 because of retirements as we monetized bonds in both years.
Provision for Income Taxes
Our effective tax rate was 36.9% for 2007 compared to 37.5% for 2006. The decrease in the effective tax rate
for 2007 was due to less state income taxes in 2007 compared to 2006.