Cabela's 2007 Annual Report Download - page 36
Download and view the complete annual report
Please find page 36 of the 2007 Cabela's annual report below. You can navigate through the pages in the report by either clicking on the pages listed below, or by using the keyword search tool below to find specific information within the annual report.-
 1
1 -
2
-
3
-
4
-
5
-
6
-
7
-
8
-
9
-
10
-
11
-
12
-
13
-
14
-
15
-
16
-
17
-
18
-
19
-
20
-
21
-
22
-
23
-
24
-
25
-
 26
26 -
 27
27 -
 28
28 -
 29
29 -
 30
30 -
 31
31 -
 32
32 -
 33
33 -
 34
34 -
 35
35 -
 36
36 -
 37
37 -
 38
38 -
 39
39 -
 40
40 -
 41
41 -
 42
42 -
 43
43 -
 44
44 -
 45
45 -
 46
46 -
47
-
48
-
49
-
50
-
51
-
52
-
53
-
54
-
55
-
56
-
57
-
58
-
59
-
60
-
61
-
62
-
63
-
64
-
65
-
66
-
67
-
68
-
69
-
70
-
71
-
72
-
73
-
74
-
75
-
76
-
77
-
78
-
79
-
80
-
81
-
82
-
83
-
84
-
85
-
86
-
87
-
88
-
89
-
90
-
91
-
92
-
93
-
94
-
95
-
96
-
97
-
98
-
99
-
100
-
101
-
102
-
103
-
104
-
105
-
106
 |
 |

30
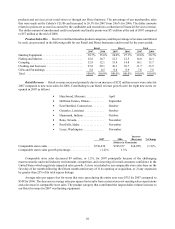
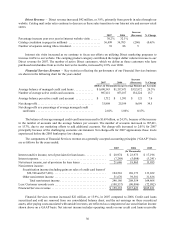
Direct Revenue – Direct revenue increased $42 million, or 3.9%, primarily from growth in sales through our
website. Catalog mail order sales continue to decrease as these sales transition to our Internet site and our new retail
stores.
2007 2006
Increase
(Decrease) % Change
Percentage increase year over year in Internet website visits ....... 30.2% 32.1%
Catalog circulation in pages (in millions) . . . . . . . . . . . . . . . . . . . . . . 36,499 36,705 (206) (0.6)%
Number of separate catalog titles circulated .................... 91 86 5
Internet site visits increased as we continue to focus our efforts on utilizing Direct marketing programs to
increase traffic to our website. The camping product category contributed the largest dollar volume increase to our
Direct revenue for 2007. The number of active Direct customers, which we define as those customers who have
purchased merchandise from us in the last twelve months, increased by 2.0% over 2006.
Financial Services Revenue – Key statistics reflecting the performance of our Financial Services business
are shown in the following chart for the years ended:
2007 2006
Increase
(Decrease) % Change
(Dollars in Thousands Except Average Balance per Account)
Average balance of managed credit card loans . . . . . . . . . . . . . $1,690,543 $1,357,671 $332,872 24.5%
Number of average active credit card accounts . . . . . . . . . . . . . 987,411 853,187 134,224 15.7
Average balance per active credit card account . . . . . . . . . . . . $ 1,712 $1,591 $121 7.6
Net charge-offs ...................................... 33,898 25,199 8,699 34.5
Net charge-offs as a percentage of average managed credit
card loans ....................................... 2.01%1.86%0.15%
The balance of average managed credit card loans increased to $1.69 billion, or 24.5%, because of the increase
in the number of accounts and the average balance per account. The number of accounts increased to 987,411,
or 15.7%, due to our marketing efforts to add additional accounts. Net charge-offs increased to 2.01% for 2007
principally because of the challenging economic environment. Net charge-offs for 2007 approximate those levels
experienced before the 2005 bankruptcy law changes.
The components of Financial Services revenue on a generally accepted accounting principles (“GAAP”) basis
are as follows for the years ended:
2007 2006 2005
(In Thousands)
Interest and fee income, net of provision for loan losses . . . . . . . . . . . . . . $ 28,974 $ 23,973 $ 17,196
Interest expense . . . . . . . . . . . . . . . . . . . . . . . . . . . . . . . . . . . . . . . . . . . . . . (7,288) (5,008) (3,241)
Net interest income, net of provision for loan losses . . . . . . . . . . . . . . . . . 21,686 18,965 13,955
Non-interest income:
Securitization income (including gains on sales of credit card loans of
$22,740 and $17,410) . . . . . . . . . . . . . . . . . . . . . . . . . . . . . . . . . . . . 194,516 169,173 133,032
Other non-interest income . . . . . . . . . . . . . . . . . . . . . . . . . . . . . . . . . . . 51,670 39,381 31,836
Total non-interest income . . . . . . . . . . . . . . . . . . . . . . . . . . . . . . . 246,186 208,554 164,868
Less: Customer rewards costs . . . . . . . . . . . . . . . . . . . . . . . . . . . . . . . . . . . (108,537) (90,096) (72,992)
Financial Services revenue . . . . . . . . . . . . . . . . . . . . . . . . . . . . . . . . . . . . . $ 159,335 $137,423 $105,831
Financial Services revenue increased $22 million, or 15.9%, in 2007 compared to 2006. Credit card loans
securitized and sold are removed from our consolidated balance sheet, and the net earnings on these securitized
assets, after paying costs associated with outside investors, are reflected as a component of our securitization income
shown above on a GAAP basis. Net interest income includes operating results on our credit card loans receivable