Cabela's 2007 Annual Report Download - page 35
Download and view the complete annual report
Please find page 35 of the 2007 Cabela's annual report below. You can navigate through the pages in the report by either clicking on the pages listed below, or by using the keyword search tool below to find specific information within the annual report.-
 1
1 -
2
-
3
-
4
-
5
-
6
-
7
-
8
-
9
-
10
-
11
-
12
-
13
-
14
-
15
-
16
-
17
-
18
-
19
-
20
-
21
-
22
-
23
-
24
-
 25
25 -
 26
26 -
 27
27 -
 28
28 -
 29
29 -
 30
30 -
 31
31 -
 32
32 -
 33
33 -
 34
34 -
 35
35 -
 36
36 -
 37
37 -
 38
38 -
 39
39 -
 40
40 -
 41
41 -
 42
42 -
 43
43 -
 44
44 -
 45
45 -
46
-
47
-
48
-
49
-
50
-
51
-
52
-
53
-
54
-
55
-
56
-
57
-
58
-
59
-
60
-
61
-
62
-
63
-
64
-
65
-
66
-
67
-
68
-
69
-
70
-
71
-
72
-
73
-
74
-
75
-
76
-
77
-
78
-
79
-
80
-
81
-
82
-
83
-
84
-
85
-
86
-
87
-
88
-
89
-
90
-
91
-
92
-
93
-
94
-
95
-
96
-
97
-
98
-
99
-
100
-
101
-
102
-
103
-
104
-
105
-
106
 |
 |

29
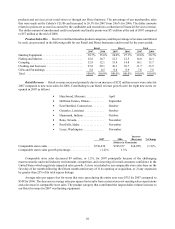
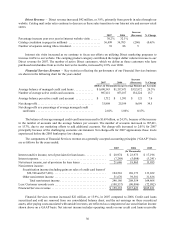
products and services at our retail stores or through our Direct business. The percentage of our merchandise sales
that were made on the Cabela’s CLUB card increased to 26.3% for 2007 from 24.6% for 2006. The dollar amounts
related to points are accrued as earned by the cardholder and recorded as a reduction in Financial Services revenue.
The dollar amount of unredeemed credit card points and loyalty points was $71 million at the end of 2007 compared
to $57 million at the end of 2006.
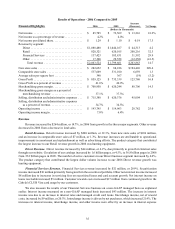
Product Sales Mix – Our five retail merchandise product categories, and the percentage of revenue contributed
by each, are presented in the following table for our Retail and Direct businesses and in total for the years ended:
Retail Direct Total
2007 2006 2007 2006 2007 2006
Hunting Equipment . . . . . . . . . . . . . . . . . . . . . . . . . . . 38.7% 35.6% 26.6% 27.1% 32.6% 30.7%
Fishing and Marine . . . . . . . . . . . . . . . . . . . . . . . . . . . 15.6 16.7 12.3 12.5 14.0 14.3
Camping. . . . . . . . . . . . . . . . . . . . . . . . . . . . . . . . . . . . 12.9 12.1 15.4 14.8 14.1 13.7
Clothing and Footwear . . . . . . . . . . . . . . . . . . . . . . . . 27.0 29.1 36.3 36.7 31.7 33.5
Gifts and Furnishings . . . . . . . . . . . . . . . . . . . . . . . . . 5.8 6.5 9.4 8.9 7.6 7.8
Tot al . . . . . . . . . . . . . . . . . . . . . . . . . . . . . . . . . . 100.0% 100.0% 100.0% 100.0% 100.0% 100.0%
Retail Revenue – Retail revenue increased primarily due to an increase of $232 million in new store sales for
2007 compared to new store sales for 2006. Contributing to our Retail revenue growth were the eight new stores we
opened in 2007 as follows:
• Hazelwood, Missouri ............. April
• Hoffman Estates, Illinois .......... September
• East Hartford, Connecticut . . . . . . . . October
• Gonzales, Louisiana . . . . . . . . . . . . . October
• Hammond, Indiana . . . . . . . . . . . . . . October
• Reno, Nevada ................... November
• Post Falls, Idaho ................. November
• Lacey, Washington . . . . . . . . . . . . . . November
2007 2006
Increase
(Decrease) % Change
(Dollars in Thousands)
Comparable stores sales . . . . . . . . . . . . . . . . . . . . . . . . . . . . . $736,430 $745,357 $(8,927) (1.2)%
Comparable stores sales growth percentage ............. (1.2)% 1.3%
Comparable store sales decreased $9 million, or 1.2%, for 2007 principally because of the challenging
macroeconomic and retail industry environment, competition, and a lowering of overall consumer confidence in the
United States which negatively impacted sales growth. A store is included in our comparable store sales base on the
first day of the month following the fifteen month anniversary of 1) its opening or acquisition, or 2) any expansion
by greater than 25% of its total square footage.
Average sales per square foot for stores that were open during the entire year were $332 for 2007 compared to
$348 for 2006. The decrease in average sales per square foot results from certain stores not meeting sales expectations
and a decrease in comparable store sales. The product category that contributed the largest dollar volume increase to
our Retail revenue for 2007 was hunting equipment.