Cabela's 2007 Annual Report Download - page 43
Download and view the complete annual report
Please find page 43 of the 2007 Cabela's annual report below. You can navigate through the pages in the report by either clicking on the pages listed below, or by using the keyword search tool below to find specific information within the annual report.-
 1
1 -
2
-
3
-
4
-
5
-
6
-
7
-
8
-
9
-
10
-
11
-
12
-
13
-
14
-
15
-
16
-
17
-
18
-
19
-
20
-
21
-
22
-
23
-
24
-
25
-
26
-
27
-
28
-
29
-
30
-
31
-
32
-
 33
33 -
 34
34 -
 35
35 -
 36
36 -
 37
37 -
 38
38 -
 39
39 -
 40
40 -
 41
41 -
 42
42 -
 43
43 -
 44
44 -
 45
45 -
 46
46 -
 47
47 -
 48
48 -
 49
49 -
 50
50 -
 51
51 -
 52
52 -
 53
53 -
54
-
55
-
56
-
57
-
58
-
59
-
60
-
61
-
62
-
63
-
64
-
65
-
66
-
67
-
68
-
69
-
70
-
71
-
72
-
73
-
74
-
75
-
76
-
77
-
78
-
79
-
80
-
81
-
82
-
83
-
84
-
85
-
86
-
87
-
88
-
89
-
90
-
91
-
92
-
93
-
94
-
95
-
96
-
97
-
98
-
99
-
100
-
101
-
102
-
103
-
104
-
105
-
106
 |
 |
37
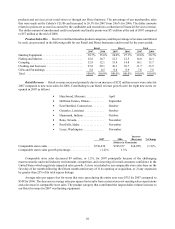
Corporate Overhead, Distribution Centers and Other:
• Strategic initiatives to expand and improve our infrastructure to support our growth resulted in an increase
in wages and benefits of $17 million primarily at our distribution centers.
• An increase in depreciation expense of $6 million from two system upgrades implemented at the end of
2005, new systems put in service during 2006, and new equipment purchases in our distribution centers.
• An increase in contract labor costs of $3 million from consulting costs related to system upgrades and
expansion.
• An increase in computer equipment and software cost of $1 million primarily from increased software
licenses.
Operating Income
Operating income increased by $29 million, or 25.0%, to $144 million for 2006. Operating income as a
percentage of revenue increased to 7.0% for 2006 from 6.4% for 2005. Our Retail segment operating income as a
percentage of revenue improved to 15.1% from 13.9% as the continued expansion helped to offset overhead costs,
and our comparable store operating costs improved with a focus on efficient labor scheduling. Operating income
as a percentage of revenue from our Direct segment was flat at 16.5% in both 2006 and 2005. Financial Services
operating income as a percentage of revenue was comparable between years, up 0.1%, to 21.9% from 21.8%, as
growth in our customer loyalty program continued to contribute positive returns. The Financial Services segment
incurs a marketing fee paid to the Retail and Direct business segments. This marketing fee is included in selling,
distribution, and administrative expenses as an expense for the Financial Services segment and as a credit to expense
for the Retail and Direct business segments. The marketing fee paid by the Financial Services segment to these two
business segments increased $16 million compared to 2005 – a $9 million increase to the Direct business segment
and a $7 million increase to the Retail segment.
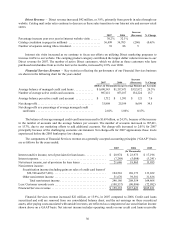
Interest (Expense) Income, Net
Interest expense, net of interest income, increased by $6 million for 2006 to $16 million from property and
equipment expenditures funded by the $215 million private placement of notes completed in February 2006. This
increase was partially offset by an increase in interest income earned on invested cash of $1 million in 2006.
Other Non-Operating Income, Net
Other income decreased by $1 million to $10 million for 2006 primarily due to a decrease in interest earned on
economic development bonds. Our investment in economic development bonds decreased by $28 million from the
monetization of certain bonds.
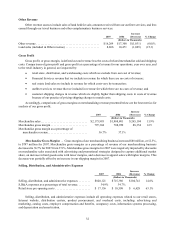
Provision for Income Taxes
Our effective tax rate was 37.5% for 2006 compared to 37.1% in 2005. The increase in our effective tax rate
primarily resulted from higher state taxes in states we opened stores in during 2006.
Bank Asset Quality
Overview
We securitize a majority of our credit card loans. On a quarterly basis, we transfer eligible credit card loans
into a securitization trust. We are required to own at least a minimum twenty day average of 5% of the interests in
the securitization trust, which is our transferor’s interest that totaled $167 million at the end of 2007. Accordingly,
retained credit card loans have the same characteristics as credit card loans sold to outside investors. Certain accounts
are ineligible for securitization for reasons such as: 1) they are delinquent, 2) they originated from sources other than
Cabela’s CLUB Visa credit cards, or 3) various other requirements. Loans ineligible for securitization totaled $15
million at the end of 2007.