Cabela's 2007 Annual Report Download - page 45
Download and view the complete annual report
Please find page 45 of the 2007 Cabela's annual report below. You can navigate through the pages in the report by either clicking on the pages listed below, or by using the keyword search tool below to find specific information within the annual report.-
 1
1 -
2
-
3
-
4
-
5
-
6
-
7
-
8
-
9
-
10
-
11
-
12
-
13
-
14
-
15
-
16
-
17
-
18
-
19
-
20
-
21
-
22
-
23
-
24
-
25
-
26
-
27
-
28
-
29
-
30
-
31
-
32
-
33
-
34
-
 35
35 -
 36
36 -
 37
37 -
 38
38 -
 39
39 -
 40
40 -
 41
41 -
 42
42 -
 43
43 -
 44
44 -
 45
45 -
 46
46 -
 47
47 -
 48
48 -
 49
49 -
 50
50 -
 51
51 -
 52
52 -
 53
53 -
 54
54 -
 55
55 -
56
-
57
-
58
-
59
-
60
-
61
-
62
-
63
-
64
-
65
-
66
-
67
-
68
-
69
-
70
-
71
-
72
-
73
-
74
-
75
-
76
-
77
-
78
-
79
-
80
-
81
-
82
-
83
-
84
-
85
-
86
-
87
-
88
-
89
-
90
-
91
-
92
-
93
-
94
-
95
-
96
-
97
-
98
-
99
-
100
-
101
-
102
-
103
-
104
-
105
-
106
 |
 |

39
Liquidity and Capital Resources
Overview
Our Retail and Direct business segments and our Financial Services business segment have significantly
differing liquidity and capital needs. The primary cash requirements of our merchandising business relate to capital
for new retail stores, purchases of inventory, investments in our management information systems and infrastructure,
purchases of economic development bonds related to the construction of new retail stores, and general working capital
needs. We historically have met these requirements with cash generated from our merchandising business operations,
borrowing under revolving credit facilities, issuing debt and equity securities, obtaining economic development
grants from state and local governments in connection with developing our retail stores, collecting principal and
interest payments on our economic development bonds, and from the retirement of economic development bonds.
Retail and Direct Business Segments – The cash flow we generate from our merchandising business is
seasonal, with our peak cash requirements for inventory occurring from April through November. While we have
consistently generated overall positive annual cash flow from our operating activities, other sources of liquidity are
required by our merchandising business during these peak cash use periods. These sources historically have included
short-term borrowings under our revolving credit facility and access to debt markets. While we generally have been
able to manage our cash needs during peak periods, if any disruption occurred to our funding sources, or if we
underestimated our cash needs, we would be unable to purchase inventory and otherwise conduct our merchandising
business to its maximum effectiveness, which could result in reduced revenue and profits.
Financial Services Business Segment (the “bank”) – The primary cash requirements of our bank relate
to the financing of credit card loans. The bank sources operating funds in the ordinary course of business through
various financing activities, which include funding obtained from securitization transactions, borrowing under its
credit agreement or federal funds purchase agreements, accepting certificates of deposit, and generating cash from
operations. The bank is prohibited by regulations from lending money to Cabela’s or other affiliates. The bank is
subject to capital requirements imposed by Nebraska banking law and the Visa membership rules, and its ability to
pay dividends is also limited by Nebraska and Federal banking law.
We believe that we will have sufficient capital available from cash on hand, our revolving credit facility, and
other borrowing sources to fund our cash requirements and near-term growth plans.
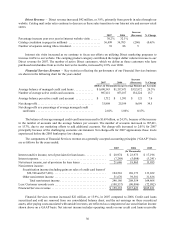
Operating, Investing and Financing Activities
The following table presents changes in our cash and cash equivalents for the years ended:
2007 2006 2005
(In Thousands)
Net cash derived from operating activities ............................................. $ 31,828 $ 54,957 $ 72,564
Net cash used in investing activities ....................................................... (331,493) (144,696) (80,617)
Net cash provided by (used in) financing activities ................................ 257,944 175,719 (28,958)
2007 versus 2006
Operating Activities – Cash derived from operating activities decreased $23 million for 2007 compared to
2006. This net decrease in cash was primarily due to a net change of $31 million in inventories, as inventory balances
increased $124 million over 2006 due to more new store openings in 2007. The inventory increase was funded by
accounts payable, which had a net increase of $42 million compared to 2006. The net increase in accounts payable
was impacted by a $40 million decrease compared to 2006 due to a decrease in the payable to the third party processor
for the bank’s credit card transactions. In addition, land held for sale or development was up $11 million over 2006 as
we increased our holdings in land investment. These uses of cash from operating activities were partially offset by an
$18 million net increase between years related to the bank’s funding from securitization transactions. For 2007, the
bank used cash for credit card originations (net of cash received from collections, proceeds from new securitizations,
and changes in retained interests) of $53 million compared to $71 million in 2006. We received $17 million in tenant
allowances during 2007, which accounts for most of the net increase of $19 million in other long-term liabilities;