Cabela's 2007 Annual Report Download - page 38
Download and view the complete annual report
Please find page 38 of the 2007 Cabela's annual report below. You can navigate through the pages in the report by either clicking on the pages listed below, or by using the keyword search tool below to find specific information within the annual report.-
 1
1 -
2
-
3
-
4
-
5
-
6
-
7
-
8
-
9
-
10
-
11
-
12
-
13
-
14
-
15
-
16
-
17
-
18
-
19
-
20
-
21
-
22
-
23
-
24
-
25
-
26
-
27
-
 28
28 -
 29
29 -
 30
30 -
 31
31 -
 32
32 -
 33
33 -
 34
34 -
 35
35 -
 36
36 -
 37
37 -
 38
38 -
 39
39 -
 40
40 -
 41
41 -
 42
42 -
 43
43 -
 44
44 -
 45
45 -
 46
46 -
 47
47 -
 48
48 -
49
-
50
-
51
-
52
-
53
-
54
-
55
-
56
-
57
-
58
-
59
-
60
-
61
-
62
-
63
-
64
-
65
-
66
-
67
-
68
-
69
-
70
-
71
-
72
-
73
-
74
-
75
-
76
-
77
-
78
-
79
-
80
-
81
-
82
-
83
-
84
-
85
-
86
-
87
-
88
-
89
-
90
-
91
-
92
-
93
-
94
-
95
-
96
-
97
-
98
-
99
-
100
-
101
-
102
-
103
-
104
-
105
-
106
 |
 |

32
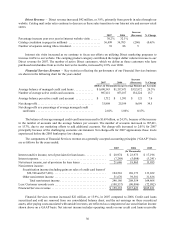
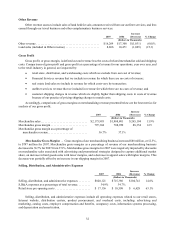
Other Revenue
Other revenue sources include sales of land held for sale, amounts received from our outfitter services, and fees
earned through our travel business and other complementary business services.
2007 2006
Increase
(Decrease) % Change
(Dollars in Thousands)
Other revenue . . . . . . . . . . . . . . . . . . . . . . . . . . . . . . . . . . . . . . . . . . . $16,269 $17,300 $ (1,031) (6.0)%
Land sales (included in Other revenue) . . . . . . . . . . . . . . . . . . . . . . . 8,866 10,471 (1,605) (15.3)
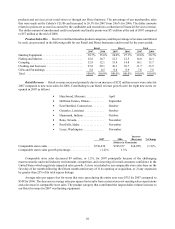
Gross Profit
Gross profit, or gross margin, is defined as total revenue less the costs of related merchandise sold and shipping
costs. Comparisons of gross profit and gross profit as a percentage of revenue for our operations, year over year, and
to the retail industry in general, are impacted by:
•retail store, distribution, and warehousing costs which we exclude from our cost of revenue;
•Financial Services revenue that we include in revenue for which there are no costs of revenue;
•real estate land sales we include in revenue for which costs vary by transaction;
•outfitter services revenue that we included in revenue for which there are no costs of revenue; and
•customer shipping charges in revenue which are slightly higher than shipping costs in costs of revenue
because of our practice of pricing shipping charges to match costs.
Accordingly, comparisons of gross margins on merchandising revenue presented below are the best metrics for
analysis of our gross profit:
2007 2006
Increase
(Decrease) % Change
(Dollars in Thousands)
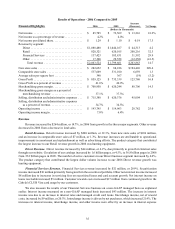
Merchandise sales ................................ $2,173,995 $1,908,801 $ 265,194 13.9%
Merchandise gross margin ......................... 797,304 708,950 88,354 12.5
Merchandise gross margin as a percentage of
merchandise revenue ........................... 36.7% 37.1%
Merchandise Gross Margins – Gross margins of our merchandising business increased $88 million, or 12.5%,
to $797 million for 2007. Merchandise gross margins as a percentage of revenue of our merchandising business
decreased to 36.7% for 2007 from 37.1%. Merchandise gross margins for 2007 were negatively impacted by discounts
on merchandise sales associated with advertising and promotional strategies designed to capture additional market
share, an increase in hard goods sales with lower margins, and a decrease in apparel sales with higher margins. This
decrease was partially offset by an increase in our shipping margin for 2007.
Selling, Distribution, and Administrative Expenses
2007 2006
Increase
(Decrease) % Change
(Dollars in Thousands)
Selling, distribution, and administrative expenses . . . . . . . . $820,121 $715,380 $104,741 14.6%
S,D&A expenses as a percentage of total revenue ......... 34.9% 34.7%
Retail store pre-opening costs ........................ $ 17,136 $ 10,508 $ 6,628 63.1%
Selling, distribution, and administrative expenses include all operating expenses related to our retail stores,
Internet website, distribution centers, product procurement, and overhead costs, including: advertising and
marketing, catalog costs, employee compensation and benefits, occupancy costs, information systems processing,
and depreciation and amortization.