Cabela's 2007 Annual Report Download - page 87
Download and view the complete annual report
Please find page 87 of the 2007 Cabela's annual report below. You can navigate through the pages in the report by either clicking on the pages listed below, or by using the keyword search tool below to find specific information within the annual report.-
 1
1 -
2
-
3
-
4
-
5
-
6
-
7
-
8
-
9
-
10
-
11
-
12
-
13
-
14
-
15
-
16
-
17
-
18
-
19
-
20
-
21
-
22
-
23
-
24
-
25
-
26
-
27
-
28
-
29
-
30
-
31
-
32
-
33
-
34
-
35
-
36
-
37
-
38
-
39
-
40
-
41
-
42
-
43
-
44
-
45
-
46
-
47
-
48
-
49
-
50
-
51
-
52
-
53
-
54
-
55
-
56
-
57
-
58
-
59
-
60
-
61
-
62
-
63
-
64
-
65
-
66
-
67
-
68
-
69
-
70
-
71
-
72
-
73
-
74
-
75
-
76
-
 77
77 -
 78
78 -
 79
79 -
 80
80 -
 81
81 -
 82
82 -
 83
83 -
 84
84 -
 85
85 -
 86
86 -
 87
87 -
 88
88 -
 89
89 -
 90
90 -
 91
91 -
 92
92 -
 93
93 -
 94
94 -
 95
95 -
 96
96 -
 97
97 -
98
-
99
-
100
-
101
-
102
-
103
-
104
-
105
-
106
 |
 |

81
CABELA’S INCORPORATED AND SUBSIDIARIES
NOTES TO CONSOLIDATED FINANCIAL STATEMENTS
(Dollars in Thousands Except Share and Per Share Amounts)
Fiscal Year 2005 Retail Direct
Financial
Services
Corporate
Overhead
and Other Tot al
Revenue from external .................. $ 618,044 $1,042,219 $106,439 $ 32,959 $1,799,661
Revenue (loss) from internal .............. 2,061 1,948 (608) (3,401) —
Total revenue ....................... $ 620,105 $ 1,044,167 $105,831 $ 29,558 $ 1,799,661
Operating income (loss).................. $ 85,895 $ 171,908 $ 23,060 $(165,900) $ 114,963
As a percentage of revenue ............ 13.9% 16.5% 21.8% N/A 6.4%
Depreciation and amortization ............ $ 12,916 $ 5,308 $ 1,089 $ 15,599 $ 34,912
Assets................................ 460,776 405,303 262,799 237,402 1,366,280
Property and equipment additions
including accrued amounts ............ 163,123 5,853 603 33,578 203,157
The components and amounts of total revenue for the Financial Services business segment were as follows for
the years ended:
2007 2006 2005
Interest and fee income, net of provision for loan losses ................. $ 28,974 $ 23,973 $ 17,196
Interest expense ................................................. (7,288) (5,008) (3,241)
Net interest income, net of provision for loan losses ............... 21,686 18,965 13,955
Non-interest income:
Securitization income ....................................... 194,516 169,173 133,032
Other non-interest income ................................... 51,670 39,381 31,836
Total non-interest income ................................. 246,186 208,554 164,868
Less: Customer rewards costs................................. (108,537) (90,096) (72,992)
Financial Services total revenue .................................... $ 159,335 $137,423 $105,831
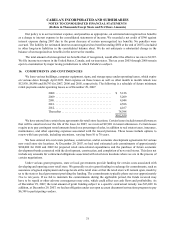
Our products are principally marketed to individuals within the United States. Net sales realized from other
geographic markets, primarily Canada, have collectively been less than 2% of consolidated net merchandise sales in
each reported period. No single customer accounted for 10% or more of consolidated net sales. No single product or
service accounts for a significant percentage of our consolidated revenue.