Cabela's 2008 Annual Report Download - page 100
Download and view the complete annual report
Please find page 100 of the 2008 Cabela's annual report below. You can navigate through the pages in the report by either clicking on the pages listed below, or by using the keyword search tool below to find specific information within the annual report.-
 1
1 -
2
-
3
-
4
-
5
-
6
-
7
-
8
-
9
-
10
-
11
-
12
-
13
-
14
-
15
-
16
-
17
-
18
-
19
-
20
-
21
-
22
-
23
-
24
-
25
-
26
-
27
-
28
-
29
-
30
-
31
-
32
-
33
-
34
-
35
-
36
-
37
-
38
-
39
-
40
-
41
-
42
-
43
-
44
-
45
-
46
-
47
-
48
-
49
-
50
-
51
-
52
-
53
-
54
-
55
-
56
-
57
-
58
-
59
-
60
-
61
-
62
-
63
-
64
-
65
-
66
-
67
-
68
-
69
-
70
-
71
-
72
-
73
-
74
-
75
-
76
-
77
-
78
-
79
-
80
-
81
-
82
-
83
-
84
-
85
-
86
-
87
-
88
-
89
-
 90
90 -
 91
91 -
 92
92 -
 93
93 -
 94
94 -
 95
95 -
 96
96 -
 97
97 -
 98
98 -
 99
99 -
 100
100 -
 101
101 -
 102
102 -
 103
103 -
 104
104 -
 105
105 -
 106
106 -
 107
107 -
 108
108 -
 109
109 -
 110
110 -
111
-
112
-
113
-
114
-
115
-
116
-
117
 |
 |

95
CABELA’S INCORPORATED AND SUBSIDIARIES
NOTES TO CONSOLIDATED FINANCIAL STATEMENTS
(Dollars in Thousands Except Share and Per Share Amounts)
infrastructure and related information systems, corporate cash and cash equivalents, economic development bonds,
prepaid expenses, deferred income taxes, and other corporate long-lived assets. Depreciation, amortization, and
property and equipment expenditures of each segment are allocated to each respective segment. The accounting
policies of the segments, where applicable, are the same as those described in the summary of significant accounting
policies in our notes to consolidated financial statements. Intercompany revenue between segments has been
eliminated in consolidation.
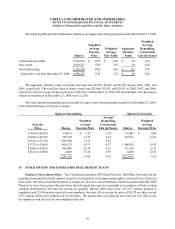
Results by business segment are presented in the following tables for 2008, 2007 and 2006:
Fiscal Year 2008 Retail Direct Financial
Services
Corporate
Overhead
and Other Total
Revenue from external customers $ 1,283,148 $1,093,307 $159,423 $16,843 $2,552,721
Revenue (loss) from internal customers 2,348 1,852 (452)(3,748) -
Total revenue $ 1,285,496 $1,095,159 $158,971 $13,095 $2,552,721
Operating income (loss) $ 141,578 $161,249 $46,184 $(207,972) $ 141,039
As a percentage of revenue 11.0%14.7%29.1%N/A 5.5%
Depreciation and amortization $ 37,930 $ 4,198 $ 1,075 $ 21,470 $64,673
Assets 988,474 663,994 728,271 15,327 2,396,066
Property and equipment additions
including accrued amounts 21,033 6,501 1,592 25,808 54,934
Fiscal Year 2007 Retail Direct Financial
Services
Corporate
Overhead
and Other Total
Revenue from external customers $ 1,040,664 $1,127,942 $159,943 $21,050 $2,349,599
Revenue (loss) from internal customers 2,778 2,611 (608)(4,781) -
Total revenue $ 1,043,442 $1,130,553 $159,335 $16,269 $2,349,599
Operating income (loss) $ 127,744 $ 190,046 $37,448 $(204,146) $ 151,092
As a percentage of revenue 12.2%16.8%23.5% N/A 6.4%
Depreciation and amortization $ 29,830 $4,462 $ 1,129 $ 24,442 $59,863
Assets 1,065,234 480,341 450,616 216,639 2,212,830
Property and equipment additions
including accrued amounts 324,272 8,466 1,037 30,551 364,326