Cabela's 2008 Annual Report Download - page 101
Download and view the complete annual report
Please find page 101 of the 2008 Cabela's annual report below. You can navigate through the pages in the report by either clicking on the pages listed below, or by using the keyword search tool below to find specific information within the annual report.-
 1
1 -
2
-
3
-
4
-
5
-
6
-
7
-
8
-
9
-
10
-
11
-
12
-
13
-
14
-
15
-
16
-
17
-
18
-
19
-
20
-
21
-
22
-
23
-
24
-
25
-
26
-
27
-
28
-
29
-
30
-
31
-
32
-
33
-
34
-
35
-
36
-
37
-
38
-
39
-
40
-
41
-
42
-
43
-
44
-
45
-
46
-
47
-
48
-
49
-
50
-
51
-
52
-
53
-
54
-
55
-
56
-
57
-
58
-
59
-
60
-
61
-
62
-
63
-
64
-
65
-
66
-
67
-
68
-
69
-
70
-
71
-
72
-
73
-
74
-
75
-
76
-
77
-
78
-
79
-
80
-
81
-
82
-
83
-
84
-
85
-
86
-
87
-
88
-
89
-
90
-
 91
91 -
 92
92 -
 93
93 -
 94
94 -
 95
95 -
 96
96 -
 97
97 -
 98
98 -
 99
99 -
 100
100 -
 101
101 -
 102
102 -
 103
103 -
 104
104 -
 105
105 -
 106
106 -
 107
107 -
 108
108 -
 109
109 -
 110
110 -
 111
111 -
112
-
113
-
114
-
115
-
116
-
117
 |
 |

96
CABELA’S INCORPORATED AND SUBSIDIARIES
NOTES TO CONSOLIDATED FINANCIAL STATEMENTS
(Dollars in Thousands Except Share and Per Share Amounts)
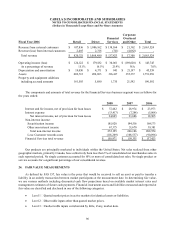
Fiscal Year 2006 Retail Direct Financial
Services
Corporate
Overhead
and Other Total
Revenue from external customers $ 817,836 $1,086,162 $138,164 $21,362 $2,063,524
Revenue (loss) from internal customers 2,485 2,318 (741)(4,062) -
Total revenue $ 820,321 $1,088,480 $137,423 $17,300 $2,063,524
Operating income (loss) $ 124,122 $179,182 $30,061 $(189,620) $ 143,745
As a percentage of revenue 15.1%16.5%21.9%N/A 7.0%
Depreciation and amortization $ 19,050 $4,371 $941 $21,197 $45,559
Assets 602,513 496,963 316,417 335,337 1,751,230
Property and equipment additions
including accrued amounts 161,585 5,680 1,735 21,592 190,592
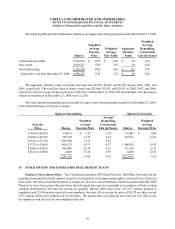
The components and amounts of total revenue for the Financial Services business segment were as follows for
the years ended:
2008 2007 2006
Interest and fee income, net of provision for loan losses $ 37,462 $28,974 $23,973
Interest expense (13,417)(7,288) (5,008)
Net interest income, net of provision for loan losses 24,045 21,686 18,965
Non-interest income:
Securitization income 185,820 194,516 169,173
Other non-interest income 67,375 51,670 39,381
Total non-interest income 253,195 246,186 208,554
Less: Customer rewards costs (118,269) (108,537)(90,096)
Financial Services total revenue $ 158,971 $159,335 $137,423
Our products are principally marketed to individuals within the United States. Net sales realized from other
geographic markets, primarily Canada, have collectively been less than 3% of consolidated net merchandise sales in
each reported period. No single customer accounted for 10% or more of consolidated net sales. No single product or
service accounts for a significant percentage of our consolidated revenue.
24. FAIR VALUE MEASUREMENTS
As defined by FAS 157, fair value is the price that would be received to sell an asset or paid to transfer a
liability in an orderly transaction between market participants at the measurement date. In determining fair value,
we use various methods including discounted cash flow projections based on available market interest rates and
management estimates of future cash payments. Financial instrument assets and liabilities measured and reported at
fair value are classified and disclosed in one of the following categories:
• Level 1 – Quoted market prices in active markets for identical assets or liabilities.
• Level 2 – Observable inputs other than quoted market prices.
• Level 3 – Unobservable inputs corroborated by little, if any, market data.