Cabela's 2008 Annual Report Download - page 46
Download and view the complete annual report
Please find page 46 of the 2008 Cabela's annual report below. You can navigate through the pages in the report by either clicking on the pages listed below, or by using the keyword search tool below to find specific information within the annual report.-
 1
1 -
2
-
3
-
4
-
5
-
6
-
7
-
8
-
9
-
10
-
11
-
12
-
13
-
14
-
15
-
16
-
17
-
18
-
19
-
20
-
21
-
22
-
23
-
24
-
25
-
26
-
27
-
28
-
29
-
30
-
31
-
32
-
33
-
34
-
35
-
 36
36 -
 37
37 -
 38
38 -
 39
39 -
 40
40 -
 41
41 -
 42
42 -
 43
43 -
 44
44 -
 45
45 -
 46
46 -
 47
47 -
 48
48 -
 49
49 -
 50
50 -
 51
51 -
 52
52 -
 53
53 -
 54
54 -
 55
55 -
 56
56 -
57
-
58
-
59
-
60
-
61
-
62
-
63
-
64
-
65
-
66
-
67
-
68
-
69
-
70
-
71
-
72
-
73
-
74
-
75
-
76
-
77
-
78
-
79
-
80
-
81
-
82
-
83
-
84
-
85
-
86
-
87
-
88
-
89
-
90
-
91
-
92
-
93
-
94
-
95
-
96
-
97
-
98
-
99
-
100
-
101
-
102
-
103
-
104
-
105
-
106
-
107
-
108
-
109
-
110
-
111
-
112
-
113
-
114
-
115
-
116
-
117
 |
 |
41
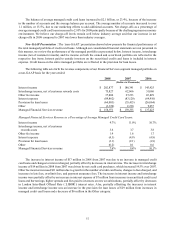
Operating income decreased $10 million, or 6.7%, for 2008 compared to 2007. Operating income as a percentage
of revenue also decreased to 5.5% for 2008 from 6.4% for 2007. Operating income comparisons between 2008
and 2007 are impacted by the challenging retail and macroeconomic environment. The decrease in total operating
income and total operating income as a percentage of total revenue was primarily due to lower revenue from our
Direct business segment, lower merchandise gross margins, and increases in selling, distribution, and administrative
expenses mostly for the addition of two new stores in 2008 and eight new stores in 2007 (six added in the fourth
quarter of 2007), along with the addition of infrastructure necessary to support this store expansion. Operating
income also includes income of $8.7 million from gift instrument breakage previously described.
The Financial Services segment incurs a marketing fee paid to the Retail and Direct business segments. This
marketing fee is included in selling, distribution, and administrative expenses as an expense for the Financial
Services segment and as a credit to expense for the Retail and Direct business segments. The marketing fee paid by
the Financial Services segment to these two business segments decreased $5 million in 2008 compared to 2007 – a
$4 million decrease to the Direct business segment and a $1 million decrease to the Retail segment.
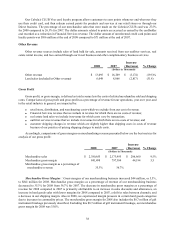
Interest (Expense) Income, Net
Interest expense, net of interest income, increased $11 million to $30 million for 2008 compared to 2007. The
net increase in interest expense was primarily due to additional debt incurred for financing our retail store expansion.
During 2008, we capitalized interest totaling $2 million on qualifying fixed assets relating primarily to retail store
construction compared to $4 million for 2007.
Other Non-Operating Income, Net
Other income was $7 million for both 2008 and 2007. This income is principally from the interest earned on
our economic development bonds. For 2007, other non-operating income also includes a pre-tax gain of $1 million
resulting from the sale of the assets of our hotel operation in Sidney, Nebraska.
Provision for Income Taxes
Our effective tax rate was 35.4% for 2008 compared to 36.9% for 2007. The effective tax rate was lower for
2008 compared to 2007 primarily due to the impact from a corporate restructure completed effective April 1, 2008,
and the release of a valuation allowance on state net operating losses.