Cabela's 2008 Annual Report Download - page 47
Download and view the complete annual report
Please find page 47 of the 2008 Cabela's annual report below. You can navigate through the pages in the report by either clicking on the pages listed below, or by using the keyword search tool below to find specific information within the annual report.-
 1
1 -
2
-
3
-
4
-
5
-
6
-
7
-
8
-
9
-
10
-
11
-
12
-
13
-
14
-
15
-
16
-
17
-
18
-
19
-
20
-
21
-
22
-
23
-
24
-
25
-
26
-
27
-
28
-
29
-
30
-
31
-
32
-
33
-
34
-
35
-
36
-
 37
37 -
 38
38 -
 39
39 -
 40
40 -
 41
41 -
 42
42 -
 43
43 -
 44
44 -
 45
45 -
 46
46 -
 47
47 -
 48
48 -
 49
49 -
 50
50 -
 51
51 -
 52
52 -
 53
53 -
 54
54 -
 55
55 -
 56
56 -
 57
57 -
58
-
59
-
60
-
61
-
62
-
63
-
64
-
65
-
66
-
67
-
68
-
69
-
70
-
71
-
72
-
73
-
74
-
75
-
76
-
77
-
78
-
79
-
80
-
81
-
82
-
83
-
84
-
85
-
86
-
87
-
88
-
89
-
90
-
91
-
92
-
93
-
94
-
95
-
96
-
97
-
98
-
99
-
100
-
101
-
102
-
103
-
104
-
105
-
106
-
107
-
108
-
109
-
110
-
111
-
112
-
113
-
114
-
115
-
116
-
117
 |
 |

42
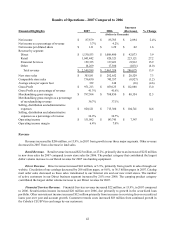
Results of Operations - 2007 Compared to 2006
Financial Highlights 2007 2006 Increase
(Decrease) % Change
(Dollars in Thousands)
Net income $ 87,879 $85,785 $2,094 2.4%
Net income as a percentage of revenue 3.7%4.2%
Net income per diluted share $ 1.31 $1.29 $.02 1.6
Revenue by segment:
Direct $1,130,553 $1,088,480 $42,073 3.9
Retail 1,043,442 820,321 223,121 27.2
Financial Services 159,335 137,423 21,912 15.9
Other 16,269 17,300 (1,031)(6.0)
Total revenue $ 2,349,599 $2,063,524 $286,075 13.9
New store sales $ 303,181 $282,652 $20,529 7.3
Comparable store sales 736,430 745,357 (8,927)(1.2)
Average sales per square foot 332 348 (16)(4.6)
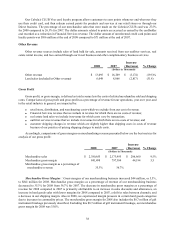
Gross Profit $ 971,213 $859,125 $112,088 13.0
Gross Profit as a percentage of revenue 41.3%41.6%
Merchandising gross margin $ 797,304 $708,950 $88,354 12.5
Merchandising gross margin as a percentage
of merchandising revenue 36.7%37.1%
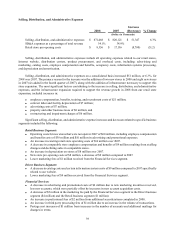
Selling, distribution and administrative
expenses $820,121 $715,380 $104,741 14.6
Selling, distribution and administrative
expenses as a percentage of revenue 34.9%34.7%
Operating income $ 151,092 $143,745 $7,347 5.1
Operating income margin 6.4%7.0%
Revenue
Revenue increased by $286 million, or 13.9%, in 2007 from growth in our three major segments. Other revenue
decreased in 2007 from a decrease in land sales.
Retail Revenue. Retail revenue increased $223 million, or 27.2%, primarily due to an increase of $232 million
in new store sales for 2007 compared to new store sales for 2006. The product category that contributed the largest
dollar volume increase to our Retail revenue for 2007 was hunting equipment.
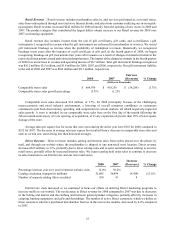
Direct Revenue. Direct revenue increased $42 million, or 3.9%, primarily from growth in sales through our
website. Circulation of our catalogs decreased by 206 million pages, or 0.6%, to 36.5 billion pages in 2007. Catalog
mail order sales decreased as these sales transitioned to our Internet site and our new retail stores. The number
of active customers in our Direct business segment increased by 2.0% over 2006. The camping product category
contributed the largest dollar volume increase to our Direct revenue for 2007.
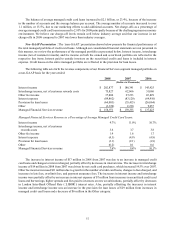
Financial Services Revenue. Financial Services revenue increased $22 million, or 15.9%, in 2007 compared
to 2006. Securitization income increased $20 million over 2006, due primarily to growth in the securitized loan
portfolio. Other non-interest income increased $12 million primarily from increases in servicing fees on securitized
loans year over year and account growth. Customer rewards costs increased $18 million from continued growth in
the Cabela’s CLUB Visa card usage by our customers.