Cabela's 2008 Annual Report Download - page 42
Download and view the complete annual report
Please find page 42 of the 2008 Cabela's annual report below. You can navigate through the pages in the report by either clicking on the pages listed below, or by using the keyword search tool below to find specific information within the annual report.-
 1
1 -
2
-
3
-
4
-
5
-
6
-
7
-
8
-
9
-
10
-
11
-
12
-
13
-
14
-
15
-
16
-
17
-
18
-
19
-
20
-
21
-
22
-
23
-
24
-
25
-
26
-
27
-
28
-
29
-
30
-
31
-
 32
32 -
 33
33 -
 34
34 -
 35
35 -
 36
36 -
 37
37 -
 38
38 -
 39
39 -
 40
40 -
 41
41 -
 42
42 -
 43
43 -
 44
44 -
 45
45 -
 46
46 -
 47
47 -
 48
48 -
 49
49 -
 50
50 -
 51
51 -
 52
52 -
53
-
54
-
55
-
56
-
57
-
58
-
59
-
60
-
61
-
62
-
63
-
64
-
65
-
66
-
67
-
68
-
69
-
70
-
71
-
72
-
73
-
74
-
75
-
76
-
77
-
78
-
79
-
80
-
81
-
82
-
83
-
84
-
85
-
86
-
87
-
88
-
89
-
90
-
91
-
92
-
93
-
94
-
95
-
96
-
97
-
98
-
99
-
100
-
101
-
102
-
103
-
104
-
105
-
106
-
107
-
108
-
109
-
110
-
111
-
112
-
113
-
114
-
115
-
116
-
117
 |
 |

37
The balance of average managed credit card loans increased to $2.1 billion, or 23.4%, because of the increase
in the number of accounts and the average balance per account. The average number of accounts increased to over
1.1 million, or 15.5%, due to our marketing efforts to add additional accounts. Net charge-offs as a percentage of
average managed credit card loans increased to 2.95% for 2008 principally because of the challenging macroeconomic
environment. We believe our charge-off levels remain well below industry average and that our increase in net
charge-offs in 2008 compared to 2007 was lower than industry averages.
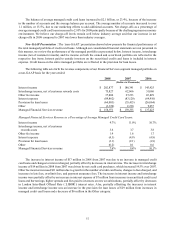
Non-GAAP Presentation – The “non-GAAP” presentation shown below presents the financial performance of
the total managed portfolio of credit card loans. Although our consolidated financial statements are not presented in
this manner, we review the performance of the managed portfolio as presented below. Interest income, interchange
income (net of customer rewards), and fee income on both the owned and securitized portfolio are reflected in the
respective line items. Interest paid to outside investors on the securitized credit card loans is included in interest
expense. Credit losses on the entire managed portfolio are reflected in the provision for loan losses.
The following table sets forth the revenue components of our Financial Services segment managed portfolio on
a non-GAAP basis for the years ended:
2008 2007 2006
(Dollars in Thousands)
Interest income $ 202,877 $ 186,341 $145,425
Interchange income, net of customer rewards costs 75,827 62,066 51,086
Other fee income 37,806 27,233 22,829
Interest expense (89,862)(83,120)(64,910)
Provision for loan losses (64,003)(35,415)(26,064)
Other (3,674)2,230 9,057
Managed Financial Services revenue $ 158,971 $159,335 $137,423
Managed Financial Services Revenue as a Percentage of Average Managed Credit Card Loans:
Interest income 9.7%11.0%10.7%
Interchange income, net of customer
rewards costs 3.6 3.7 3.8
Other fee income 1.9 1.6 1.7
Interest expense (4.3)(4.9)(4.8)
Provision for loan losses (3.1)(2.1)(1.9)
Other (0.2)0.1 0.6
Managed Financial Services revenue 7.6%9.4%10.1%
The increase in interest income of $17 million in 2008 from 2007 was due to an increase in managed credit
card loans and changes to interest charged, partially offset by decreases in interest rates. The increase in interchange
income of $14 million in 2008 from 2007 was driven by net credit card purchases, which increased 14.5% over 2007.
Other fee income increased $11 million due to growth in the number of credit card loans, changes to fees charged, and
increases in late fees, overlimit fees, and payment assurance fees. The increases in interest income and interchange
income were partially offset by an increase in interest expense of $7 million from increases in securitized credit card
loans and borrowings, higher spreads and fees paid to investors on new securitizations, partially offset by decreases
in London Inter-Bank Offered Rate (“LIBOR”) interest rates. Also, partially offsetting the increases in interest
income and interchange income was an increase in the provision for loan losses of $29 million from increases in
managed credit card loans and a decrease of $6 million in the Other category.